Chapter 13 Associations between earlier and later growth failure.
13.1 Risk of growth faltering at older ages by type of growth faltering at earlier ages
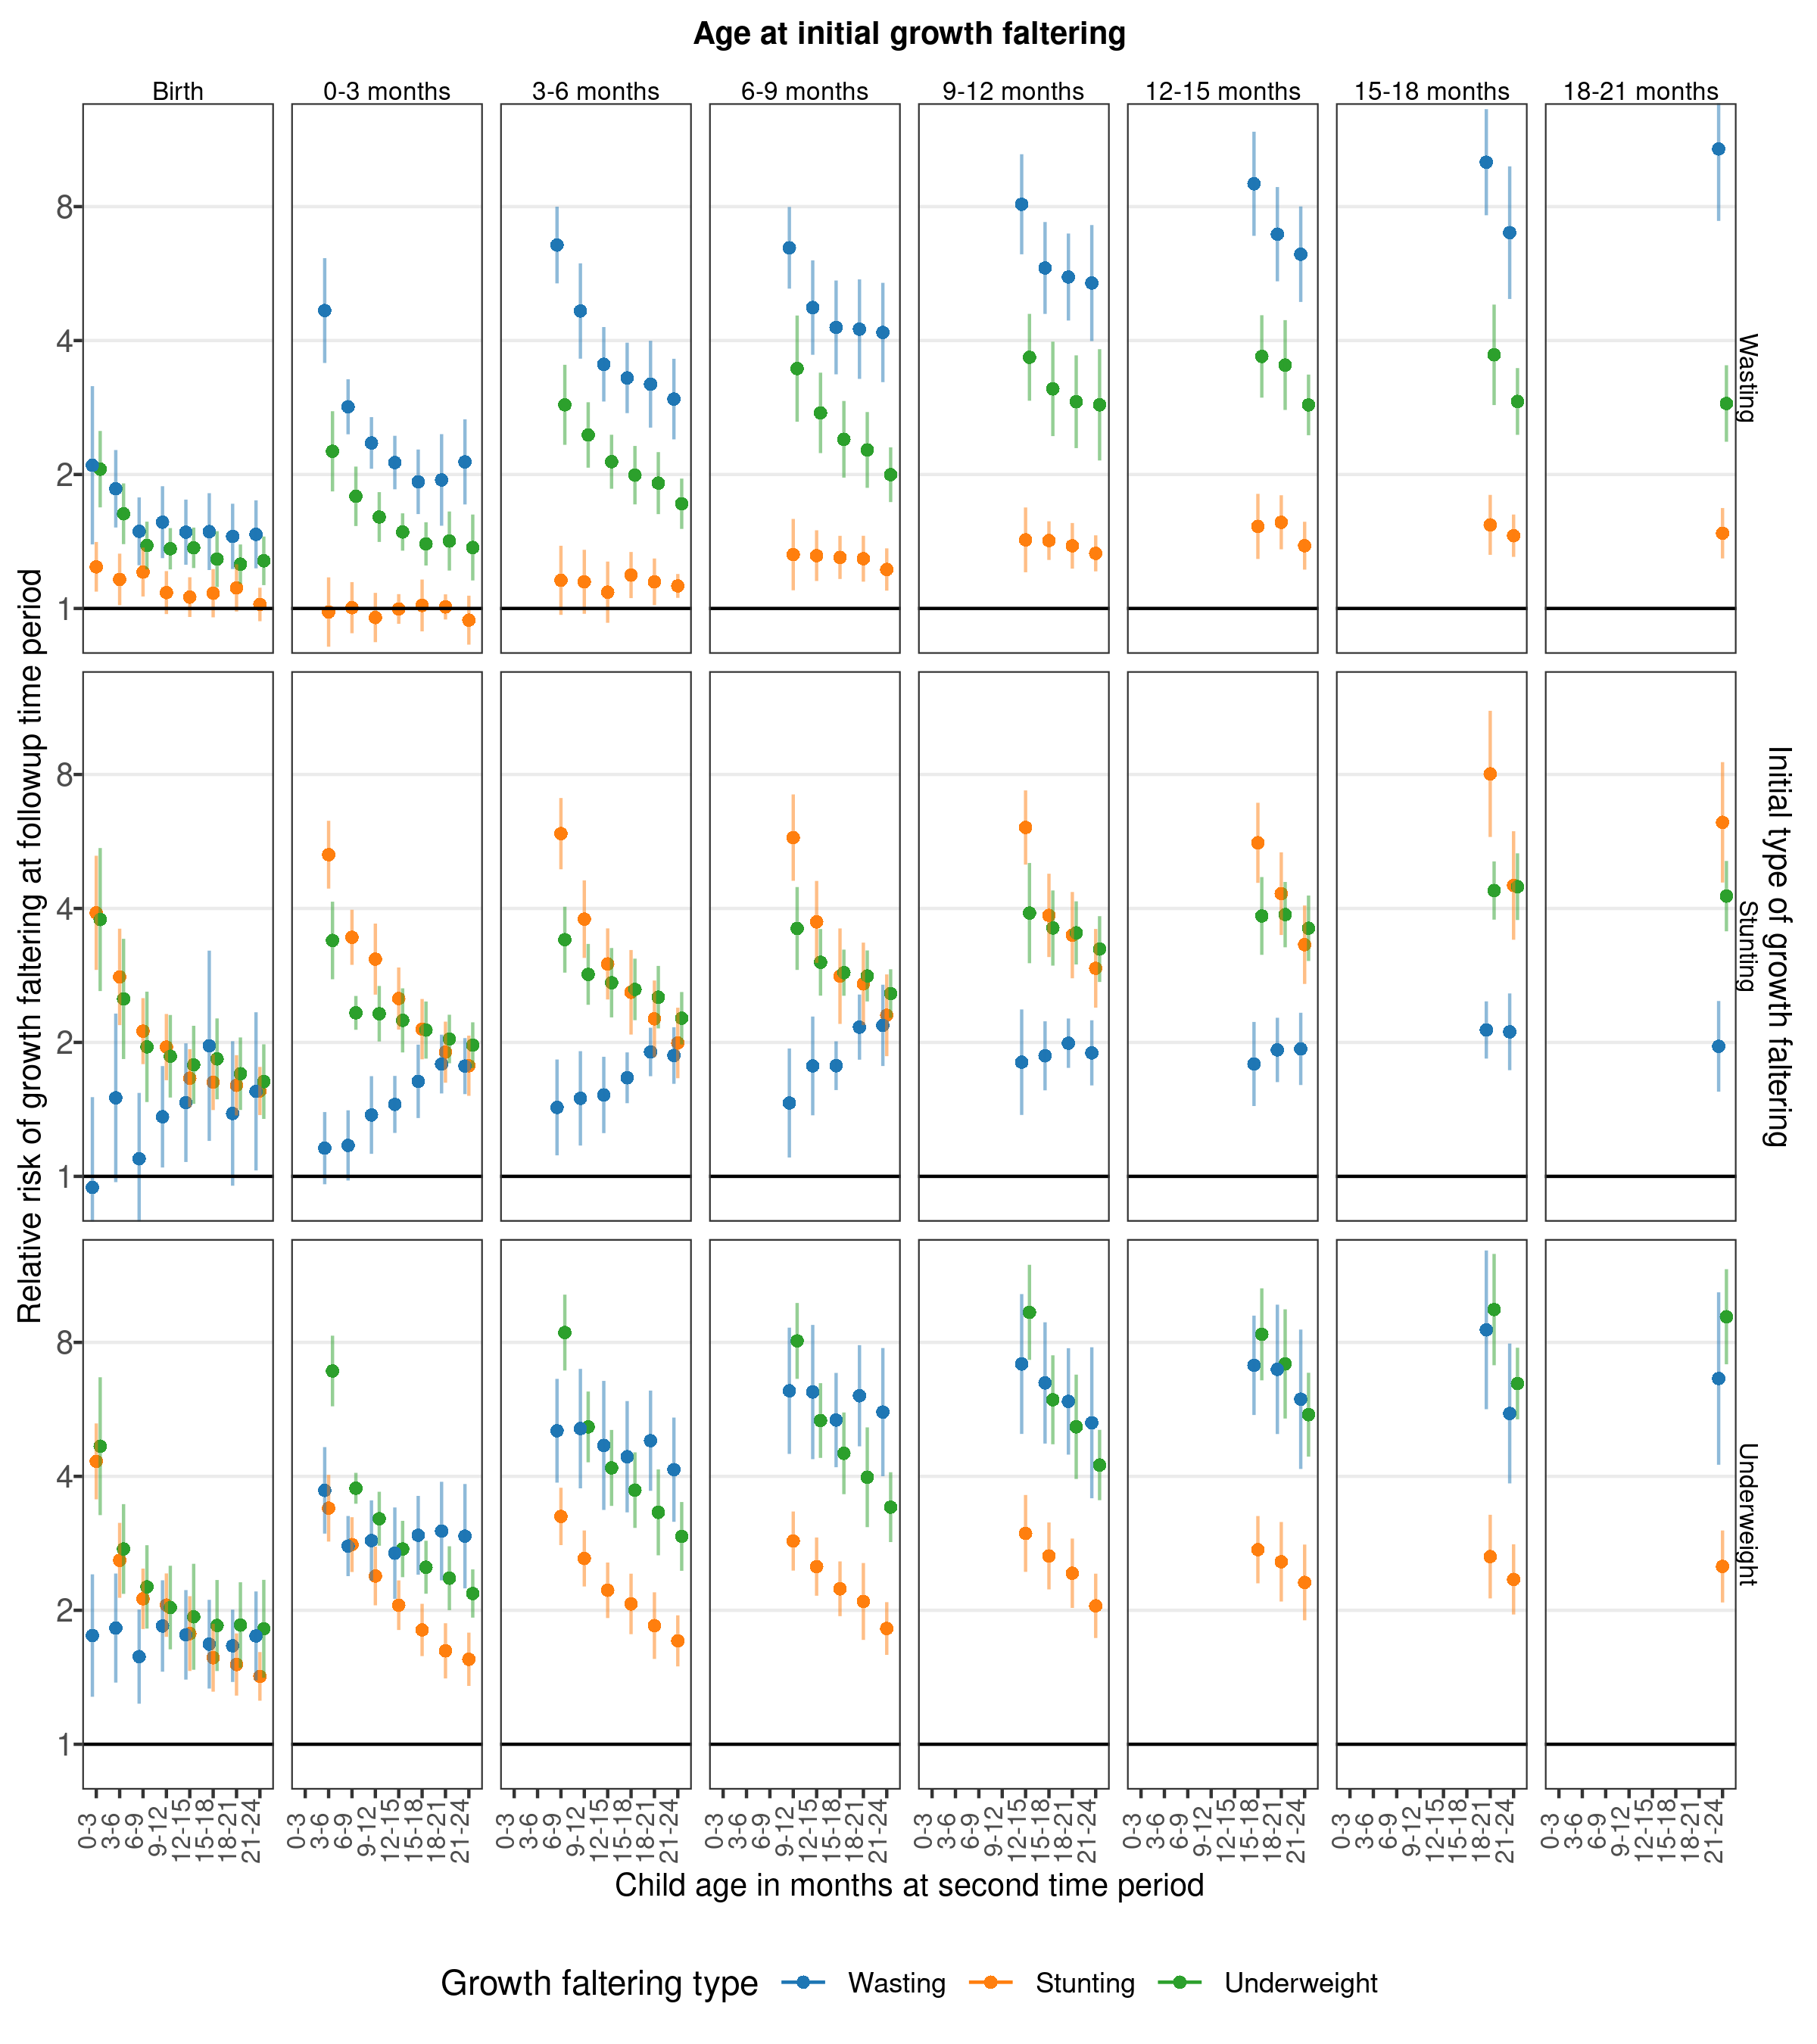
Relative risks of future prevalences of growth failure by type and age of earlier prevalences of growth failure. Points indicate relative risks of future growth failure with the type of growth failure marked by point color and the age at which the secondary growth failure occurs on the X-axis. Each column is a different age at which the primary growth failure occurs, and each row is the type of primary growth failure. Vertical lines mark 95% confidence intervals. For example, in the top right panel, the points indicate relative risks of being wasted (blue), stunted (orange), or underweight (green) at any time during the 21-24 month period, comparing children who were wasted during the 18-21 month period against a reference of children who were note wasted during the 18-21 month period.
Details on estimation of the relative risks within the individual cohorts and the random effects models are in the methods.