Chapter 10 Child wasting and underweight stratified by low birthweight and preterm birth status
10.1 Tables of birthweight and gestational age availability.
Note that gestational age was only measured in four small cohorts with monthly measurements, two from sub-Saharan Africa and two from India. The Indian cohorts in particular include a little over 200 children each. Some estimates are grouped by region, but note the data is not sufficient in number of children or diversity of populations to make regional extrapolations, especially for the rare categories like born preterm with normal birthweight (>2500g). The gestational age data is also not based on ultrasound data, so is measured imprecisely based on last menstrual recall or the Dubowitz method (newborn exam).
| Study | Normal or high birthweight | Low birthweight |
|---|---|---|
| CMC-V-BCS-2002-INDIA | 322 (88.2%) | 43 (11.8%) |
| EE-PAKISTAN | 245 (64.6%) | 134 (35.4%) |
| GMS-Nepal-NEPAL | 96 (68.6%) | 44 (31.4%) |
| IRC-INDIA | 335 (82.9%) | 69 (17.1%) |
| Keneba-GAMBIA | 1805 (85.2%) | 313 (14.8%) |
| MAL-ED-BANGLADESH | 203 (78.7%) | 55 (21.3%) |
| MAL-ED-BRAZIL | 221 (94.8%) | 12 (5.2%) |
| MAL-ED-INDIA | 205 (83.7%) | 40 (16.3%) |
| MAL-ED-NEPAL | 212 (91%) | 21 (9%) |
| MAL-ED-PERU | 279 (93.3%) | 20 (6.7%) |
| MAL-ED-SOUTH AFRICA | 290 (92.4%) | 24 (7.6%) |
| MAL-ED-TANZANIA | 125 (94.7%) | 7 (5.3%) |
| PROVIDE-BANGLADESH | 532 (76%) | 168 (24%) |
| TanzaniaChild2-TANZANIA | 2293 (96.5%) | 82 (3.5%) |
| TDC-INDIA | 133 (88.1%) | 18 (11.9%) |
| Study | Full or late term | Early term | Preterm |
|---|---|---|---|
| CMC-V-BCS-2002-INDIA | 215 (61.3%) | 84 (23.9%) | 52 (14.8%) |
| IRC-INDIA | 250 (64.1%) | 98 (25.1%) | 42 (10.8%) |
| Keneba-GAMBIA | 847 (49.4%) | 609 (35.6%) | 257 (15%) |
| TanzaniaChild2-TANZANIA | 1393 (61.7%) | 515 (22.8%) | 350 (15.5%) |
| Study | Normal or high birthweight-Full or late term | Normal or high birthweight-Early term | Normal or high birthweight-Preterm | Low birthweight-Full or late term | Low birthweight-Early term | Low birthweight-Preterm |
|---|---|---|---|---|---|---|
| CMC-V-BCS-2002-INDIA | 195 (56.7%) | 70 (20.3%) | 39 (11.3%) | 16 (4.7%) | 12 (3.5%) | 12 (3.5%) |
| IRC-INDIA | 217 (56.1%) | 76 (19.6%) | 27 (7%) | 33 (8.5%) | 20 (5.2%) | 14 (3.6%) |
| Keneba-GAMBIA | 756 (44.8%) | 516 (30.6%) | 173 (10.2%) | 80 (4.7%) | 82 (4.9%) | 82 (4.9%) |
| TanzaniaChild2-TANZANIA | 1356 (60.6%) | 492 (22%) | 315 (14.1%) | 26 (1.2%) | 16 (0.7%) | 33 (1.5%) |
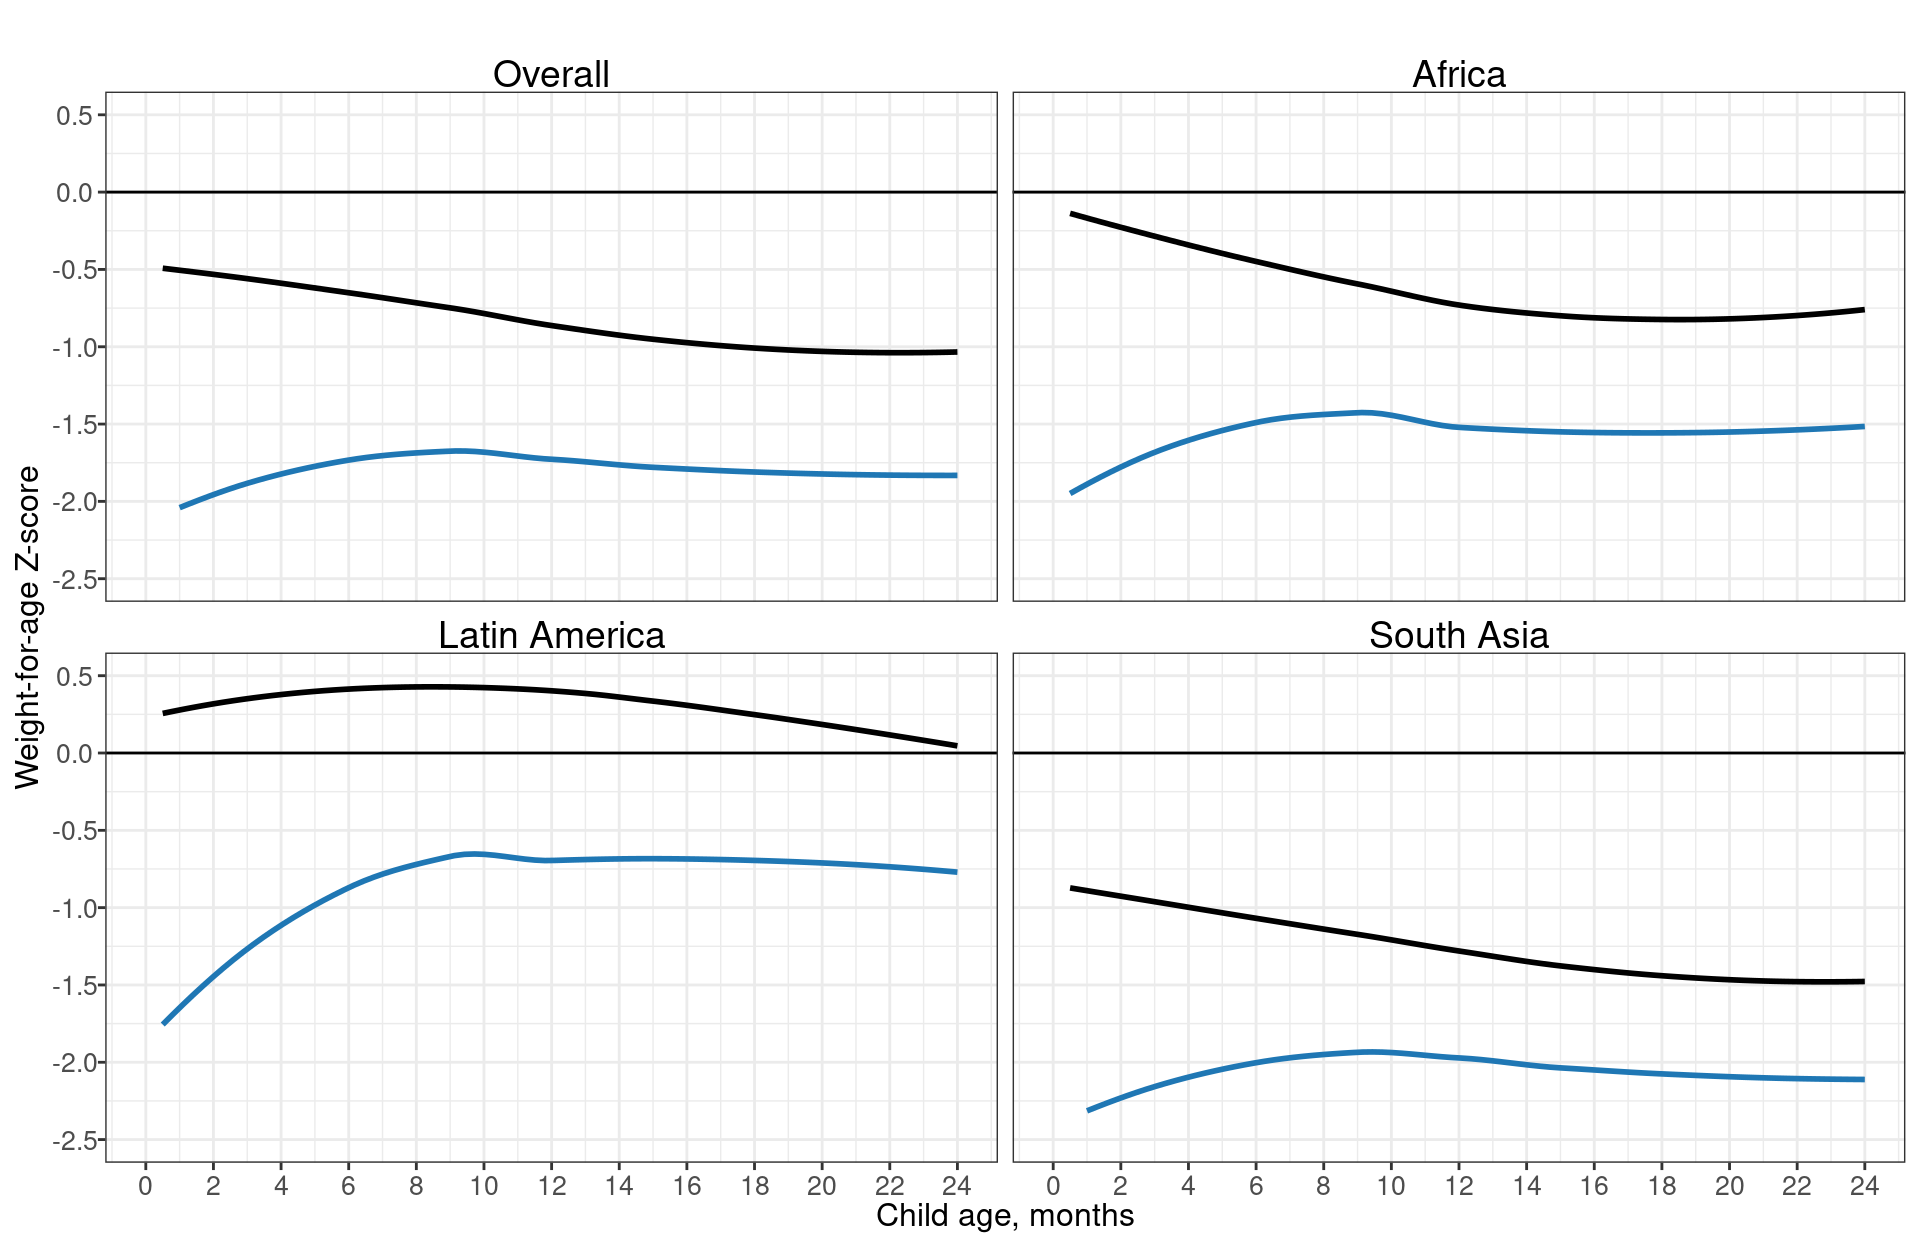
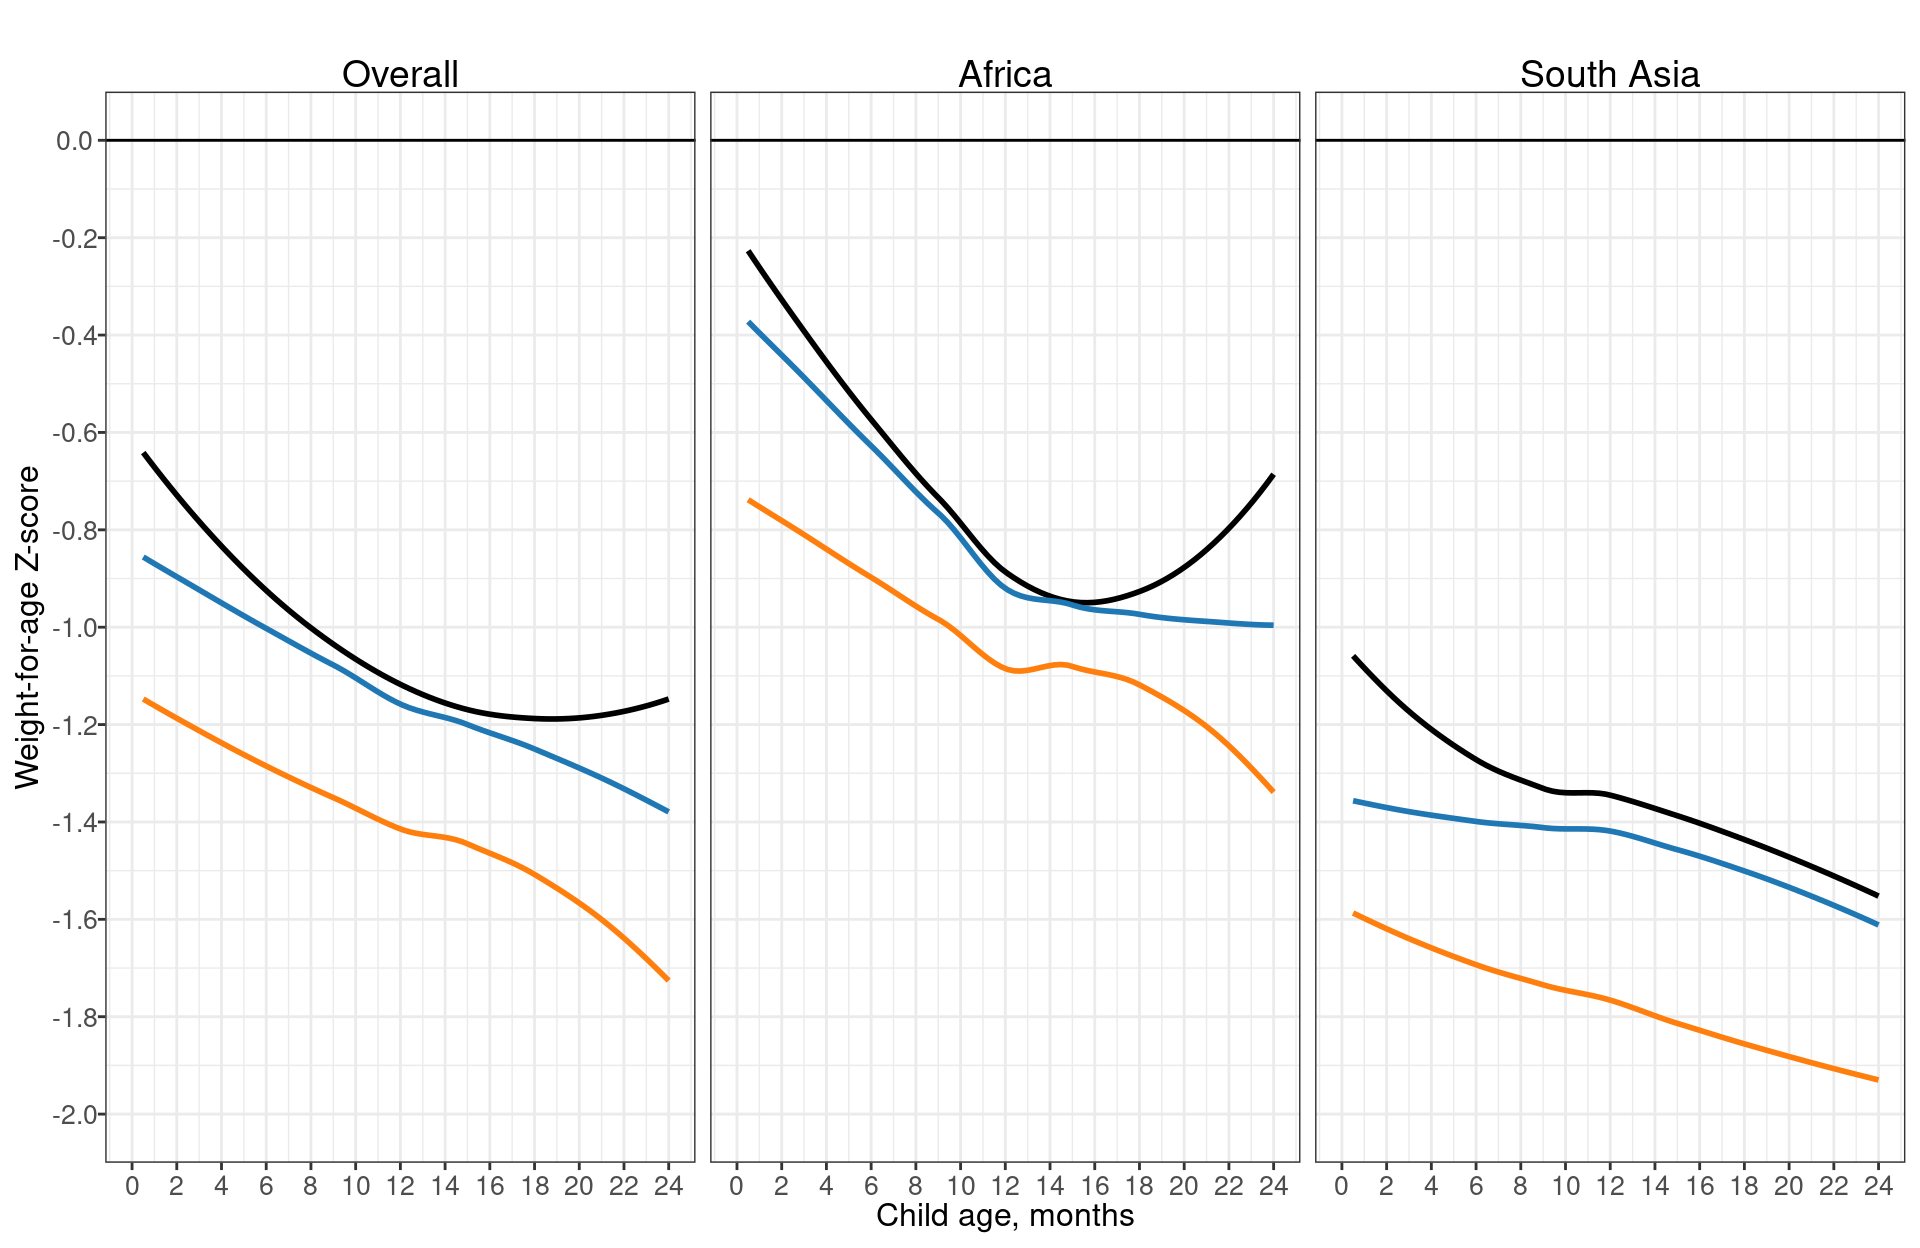
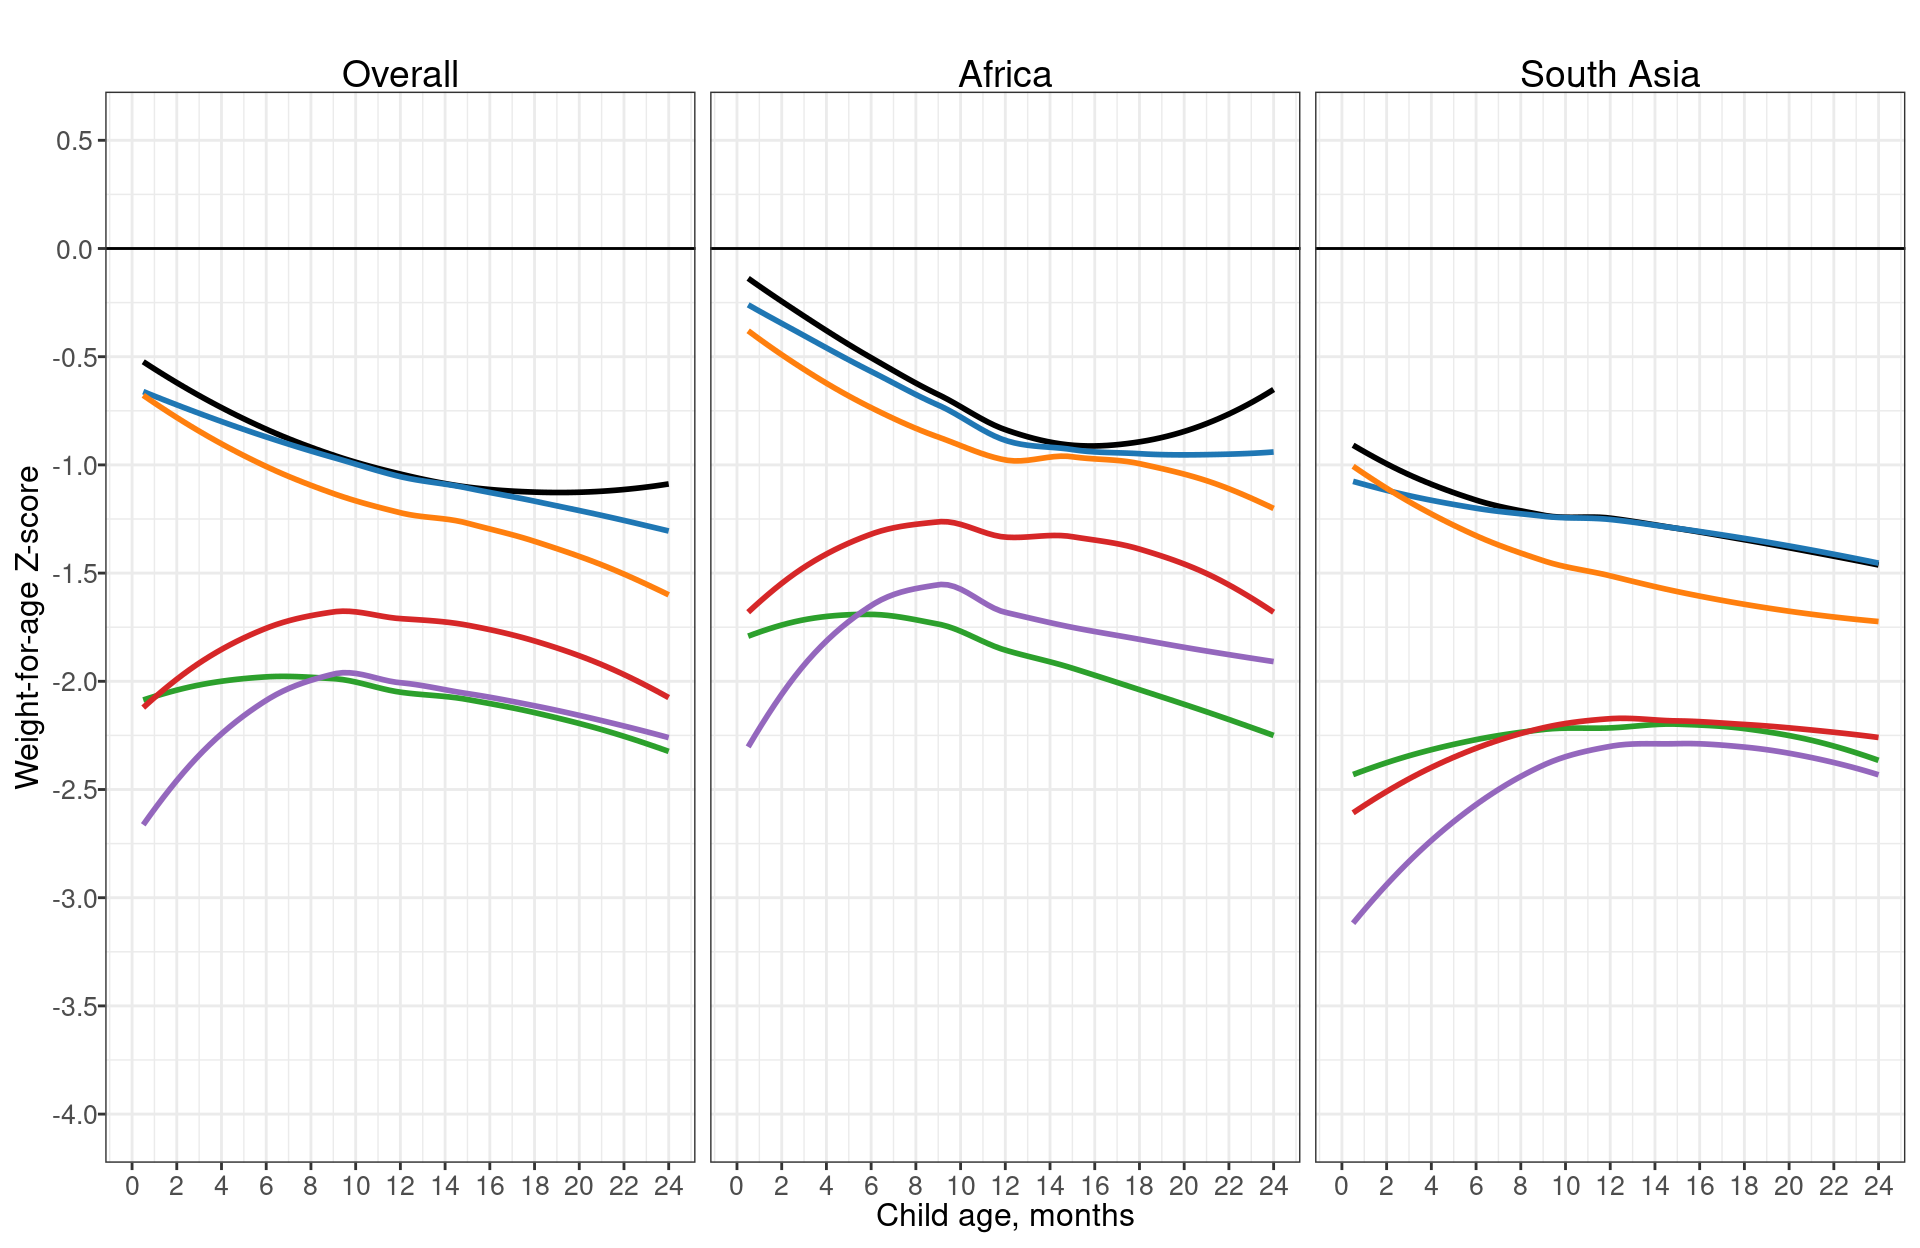
10.2 Weight-for-age Z-scores (WAZ)
10.2.1 Age-specific WAZ stratified by birthweight
10.2.2 Age-specific WAZ stratified by gestational age
10.2.3 Age-specific WAZ stratified by birthweight and gestational age
10.3 Weight-for-length Z-scores (WLZ)
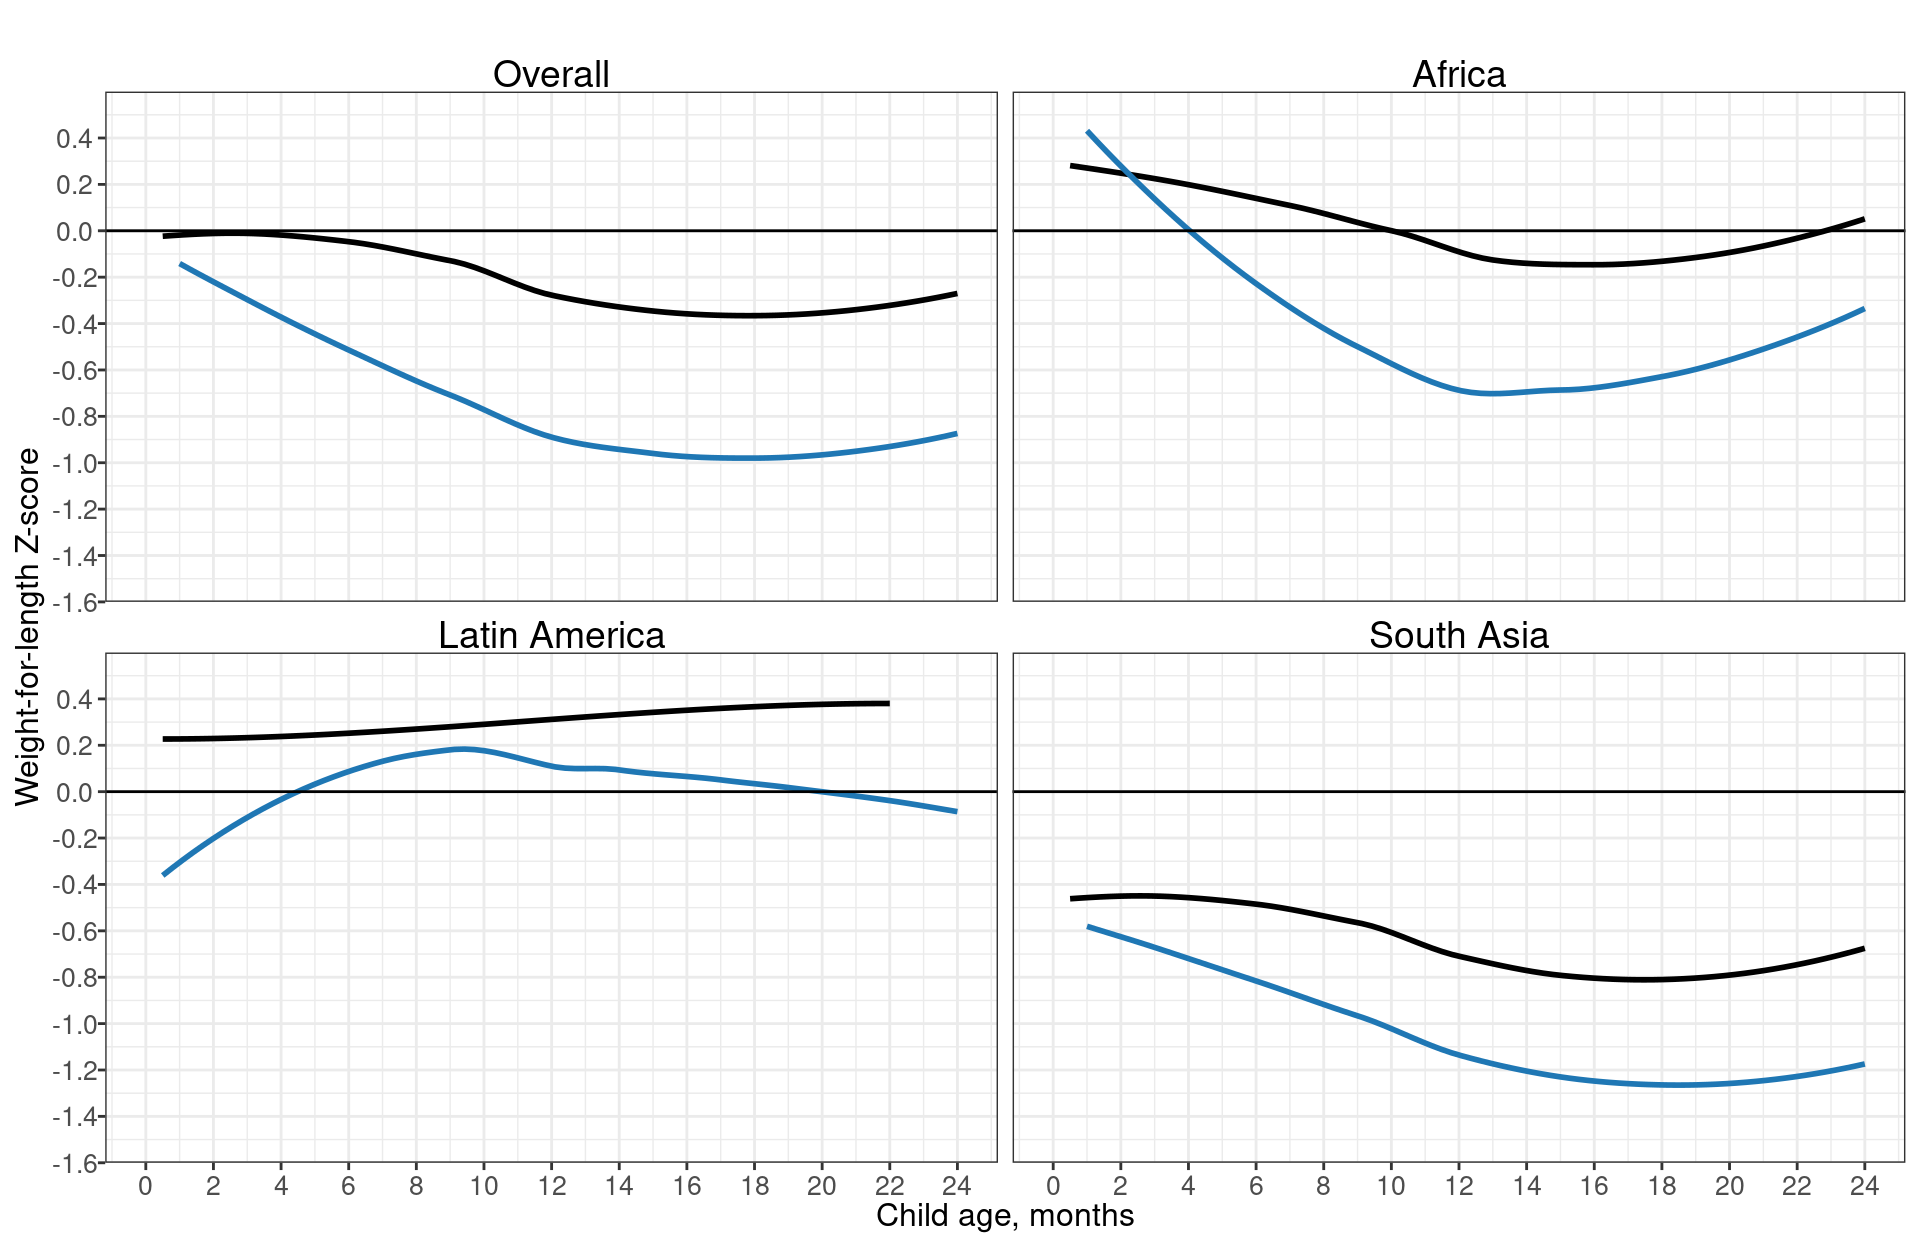
10.3.1 Age-specific WLZ stratified by birthweight
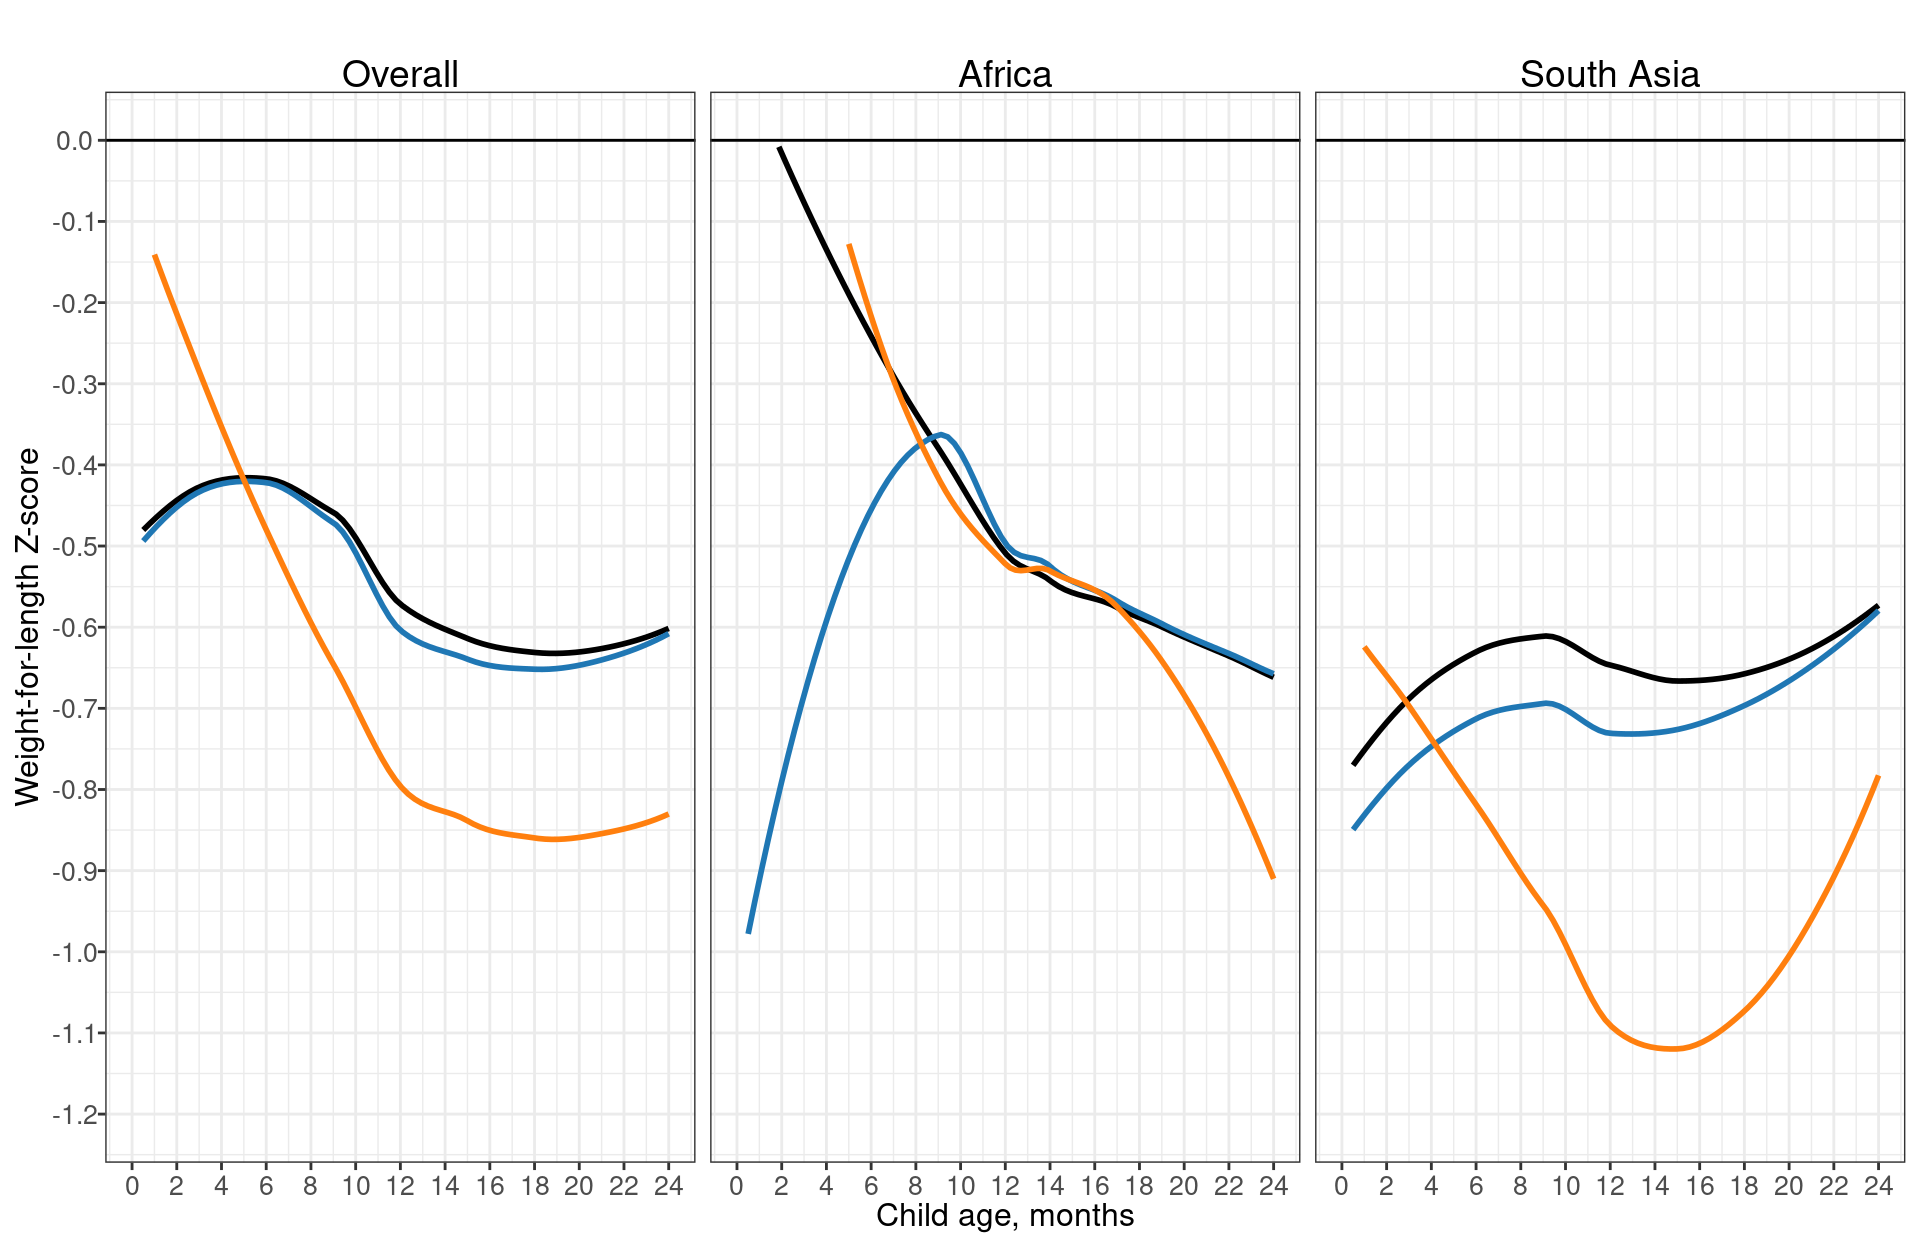
10.3.2 Age-specific WLZ stratified by gestational age
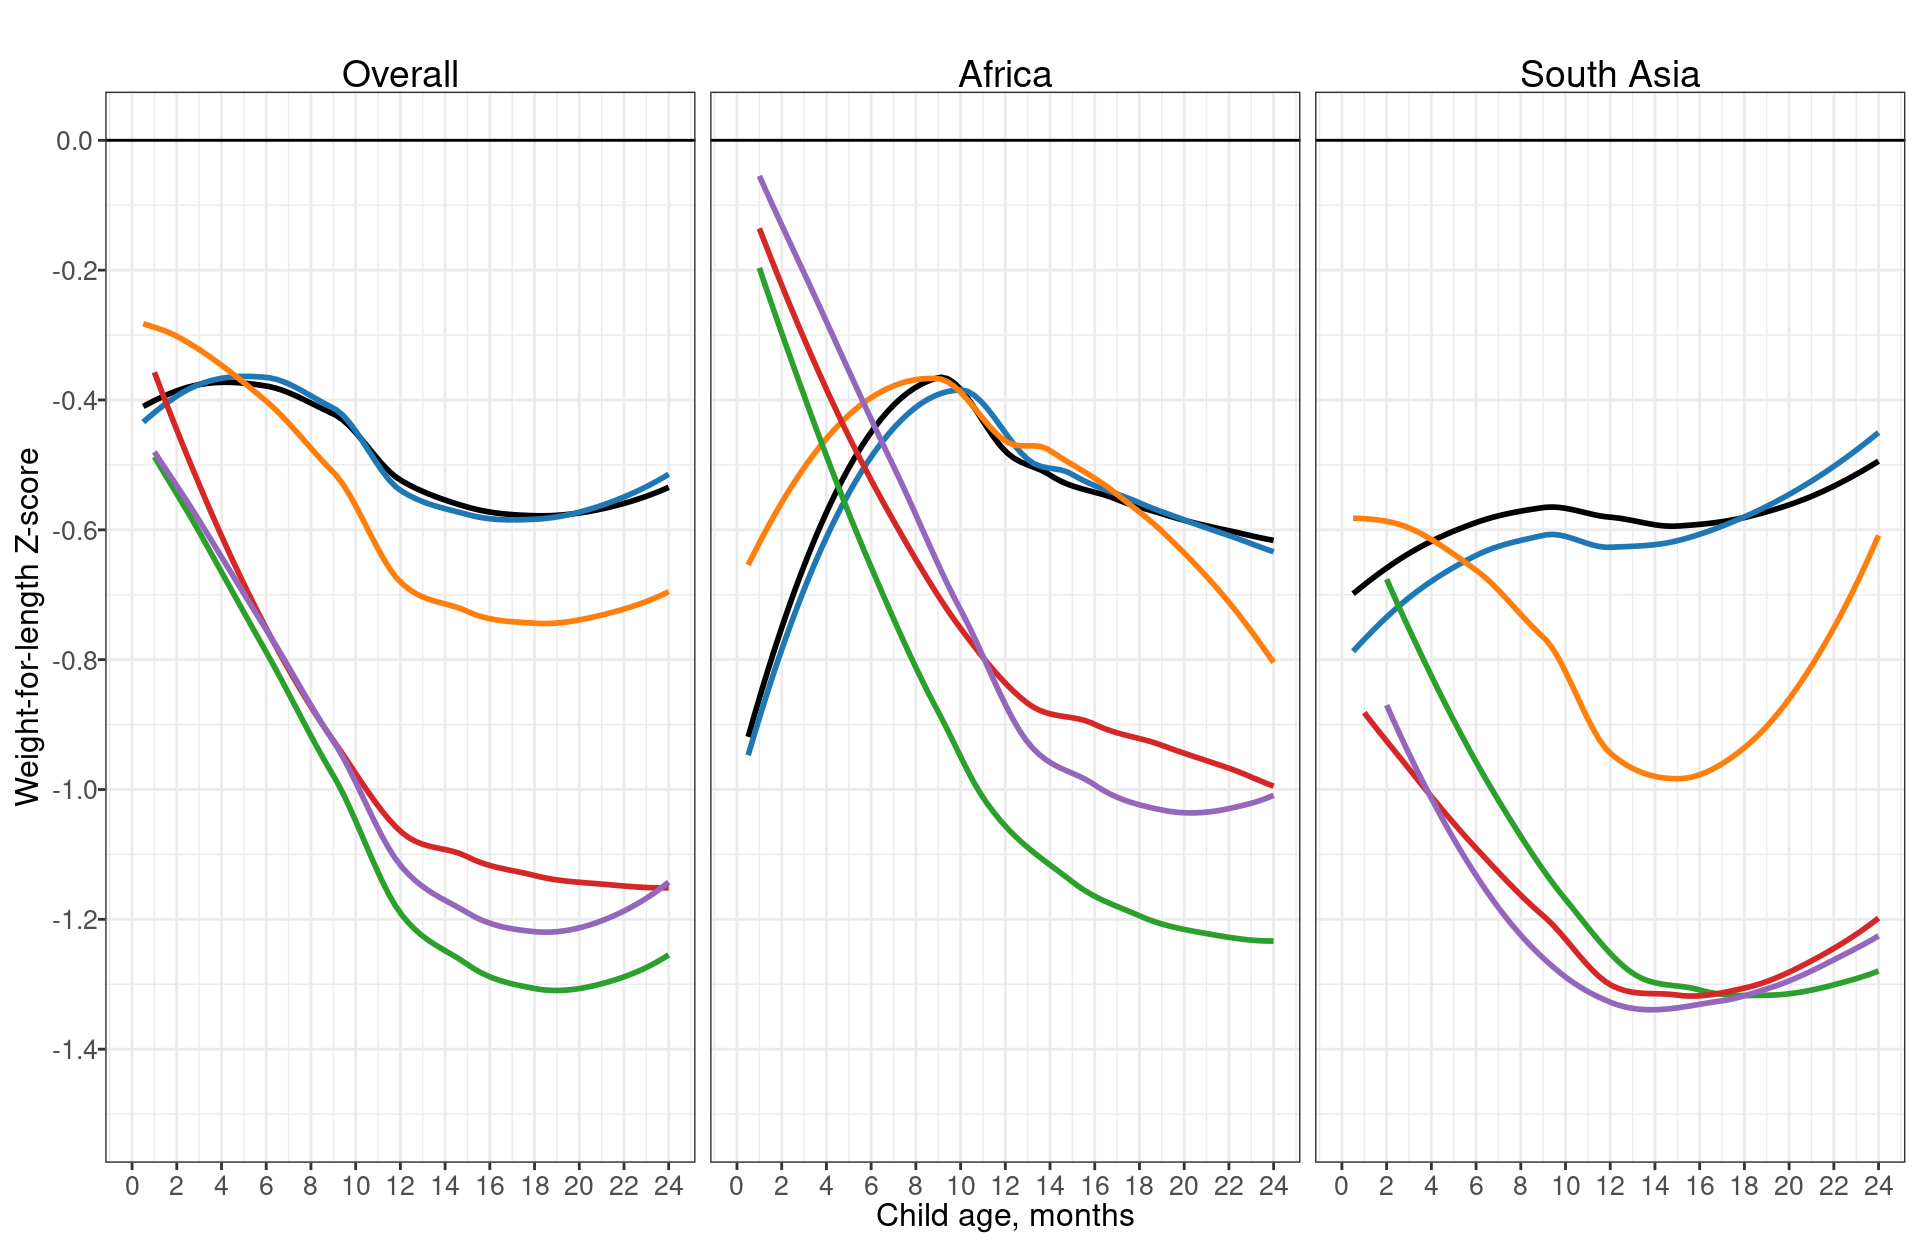
10.3.3 Age-specific WLZ stratified by birthweight and gestational age
10.4 Prevalence of wasting
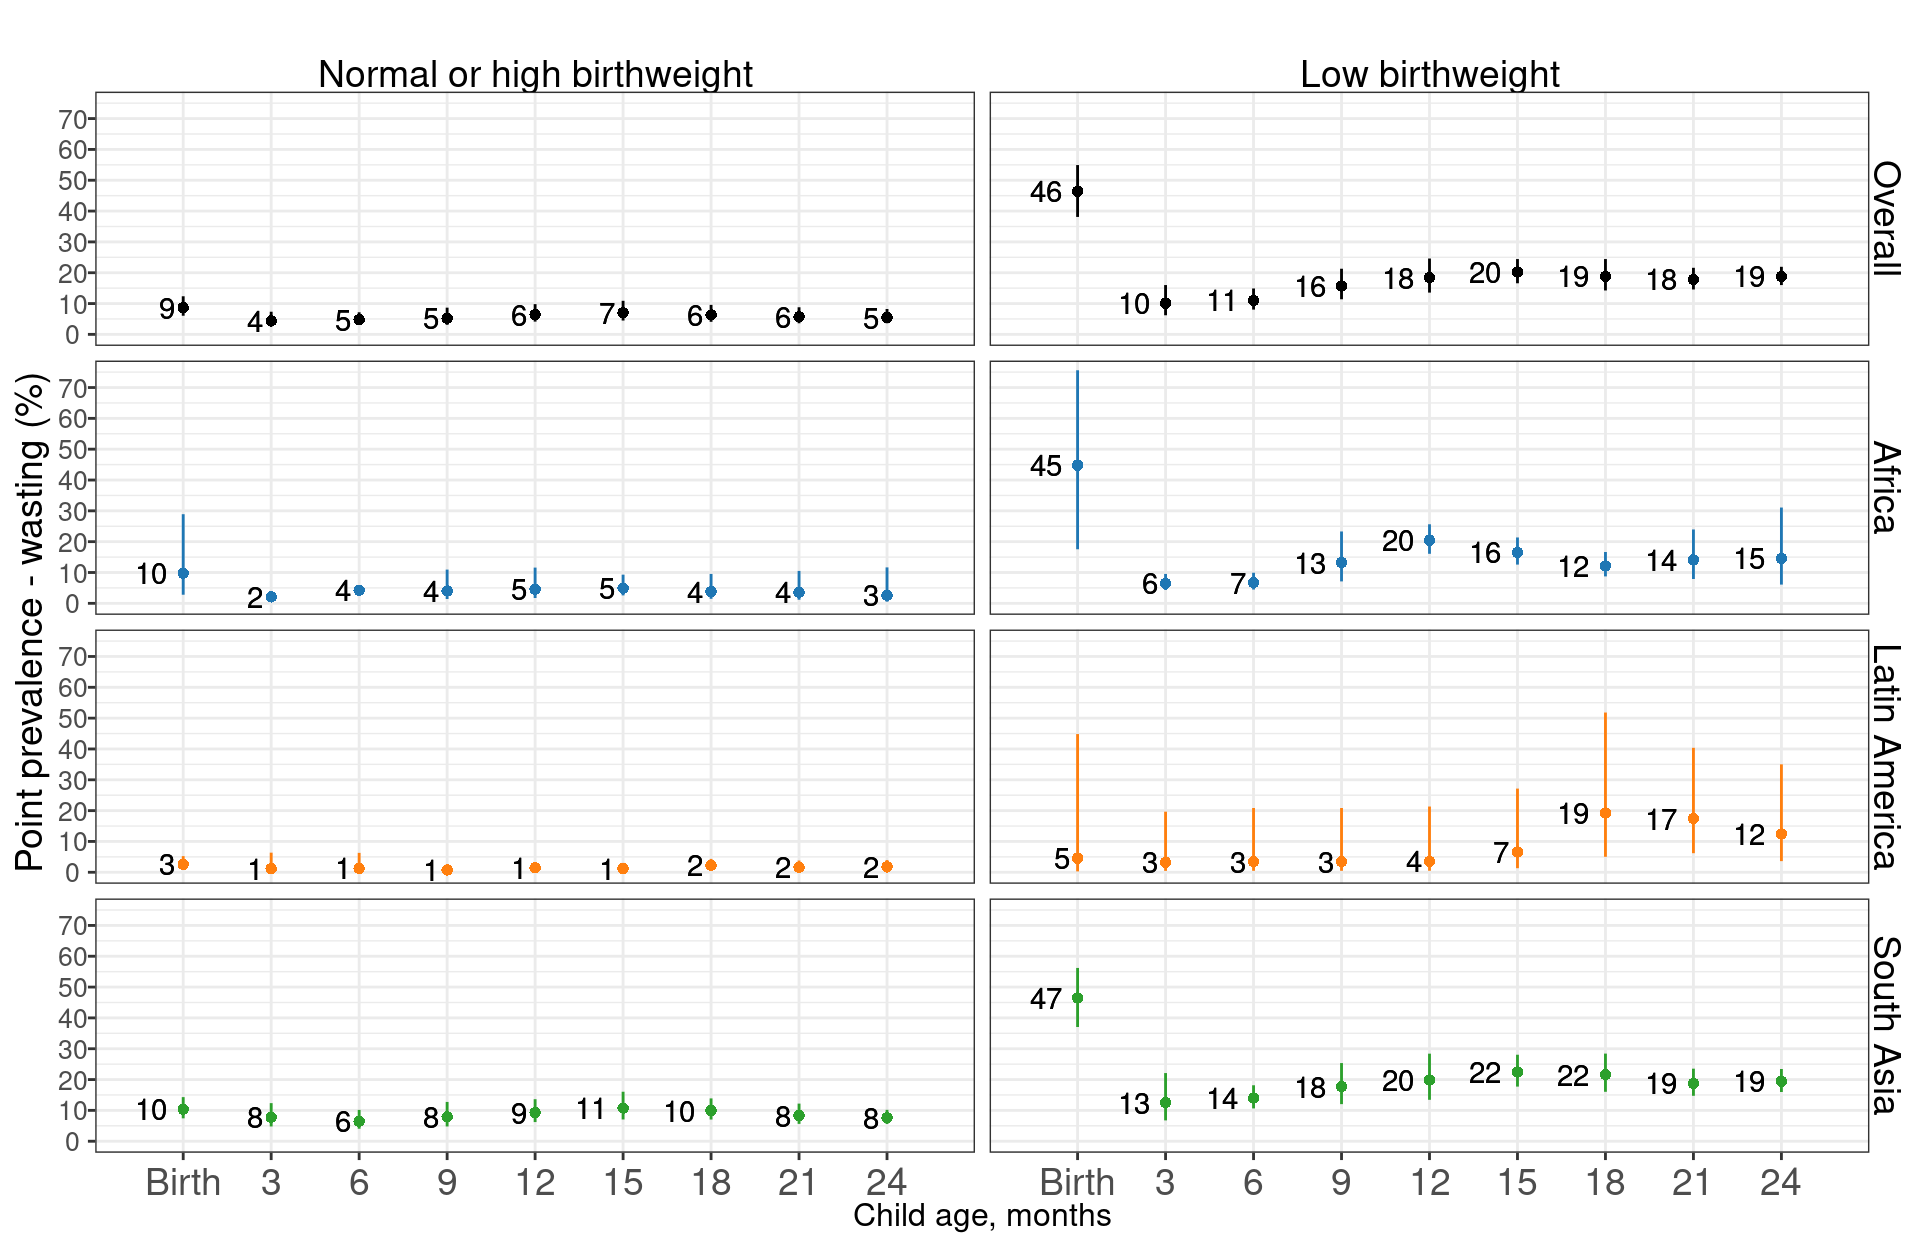
10.4.1 Age-specific prevalence of wasting, stratified by birthweight
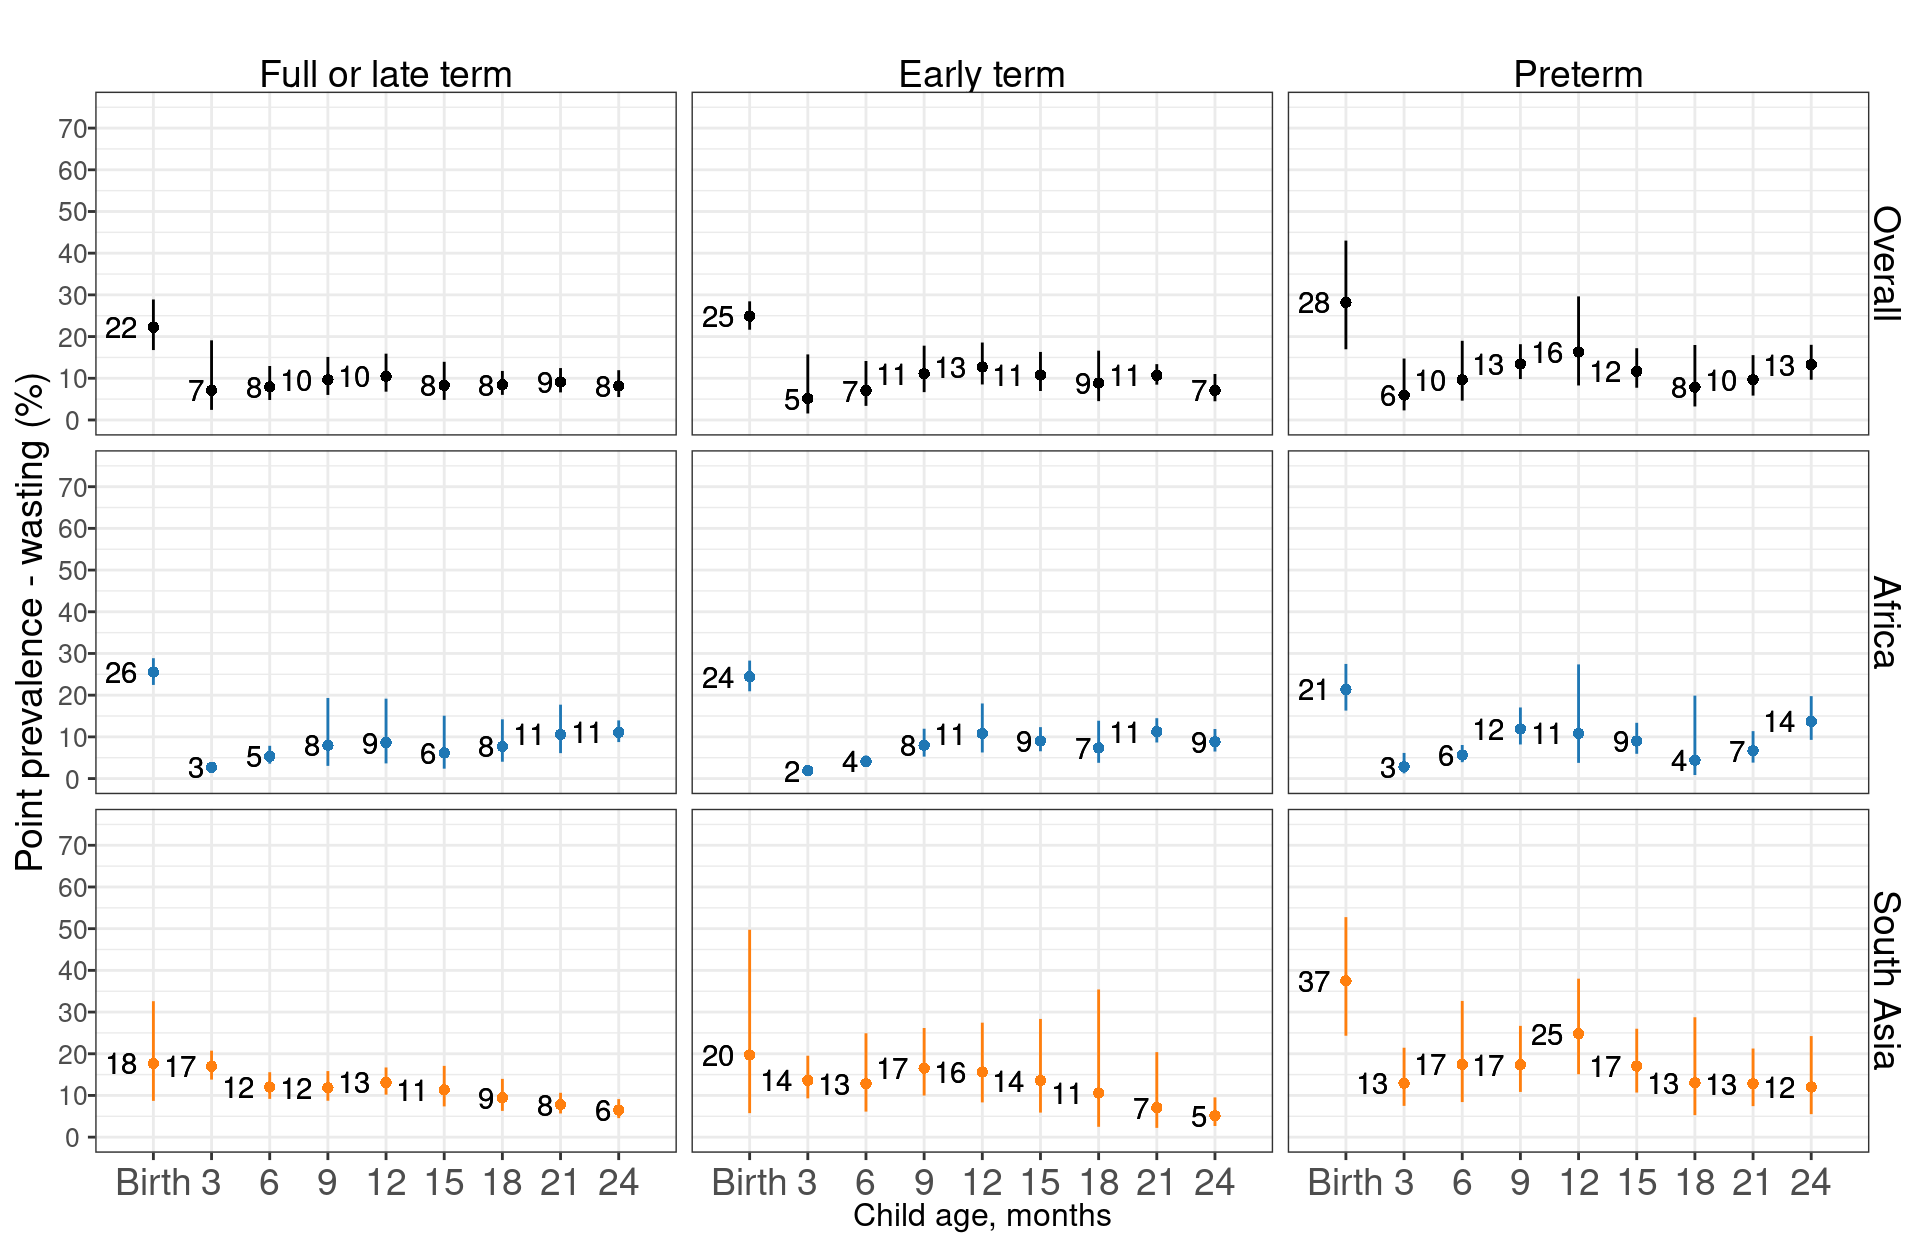
10.4.2 Age-specific prevalence of wasting, stratified by gestational age
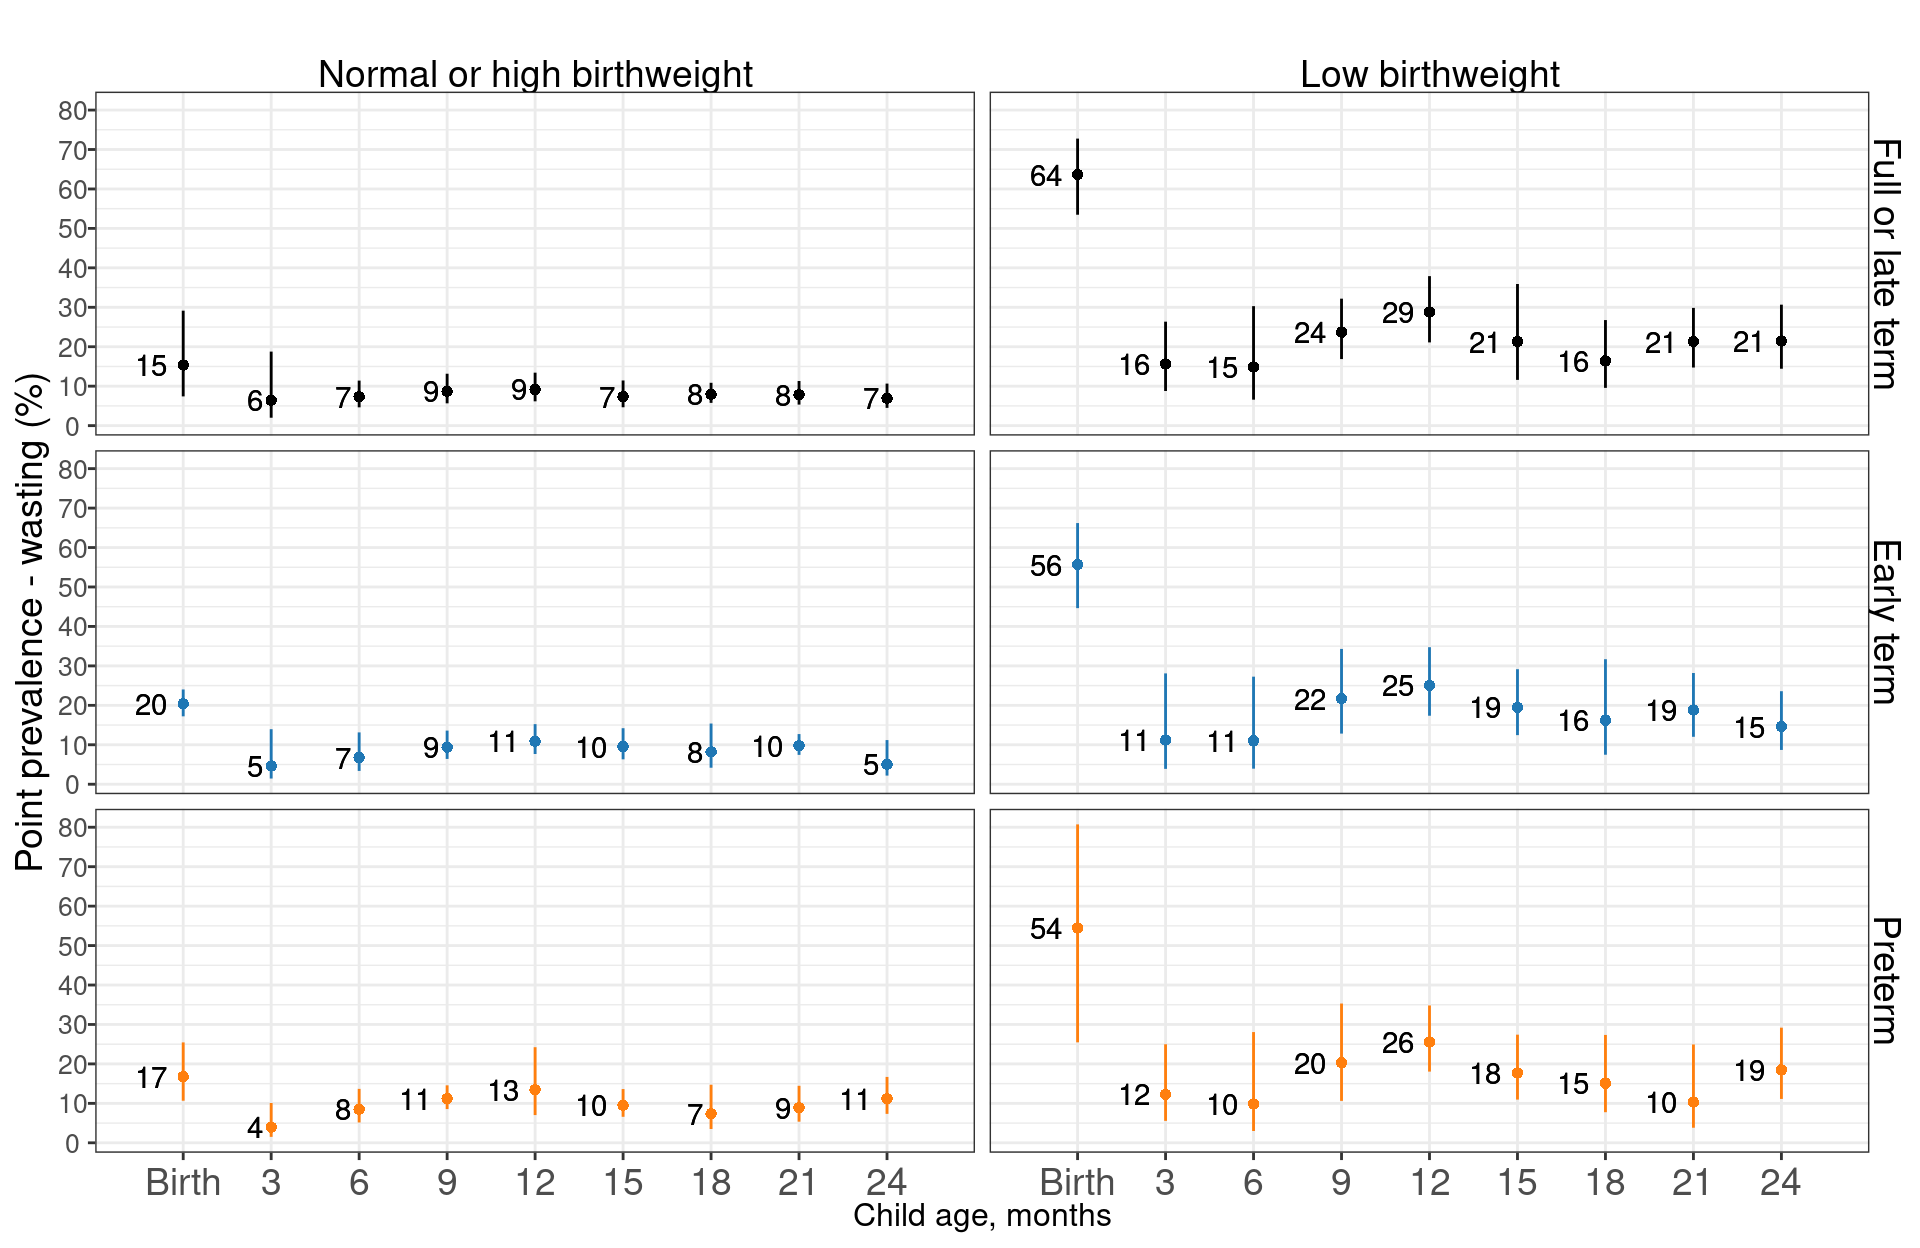
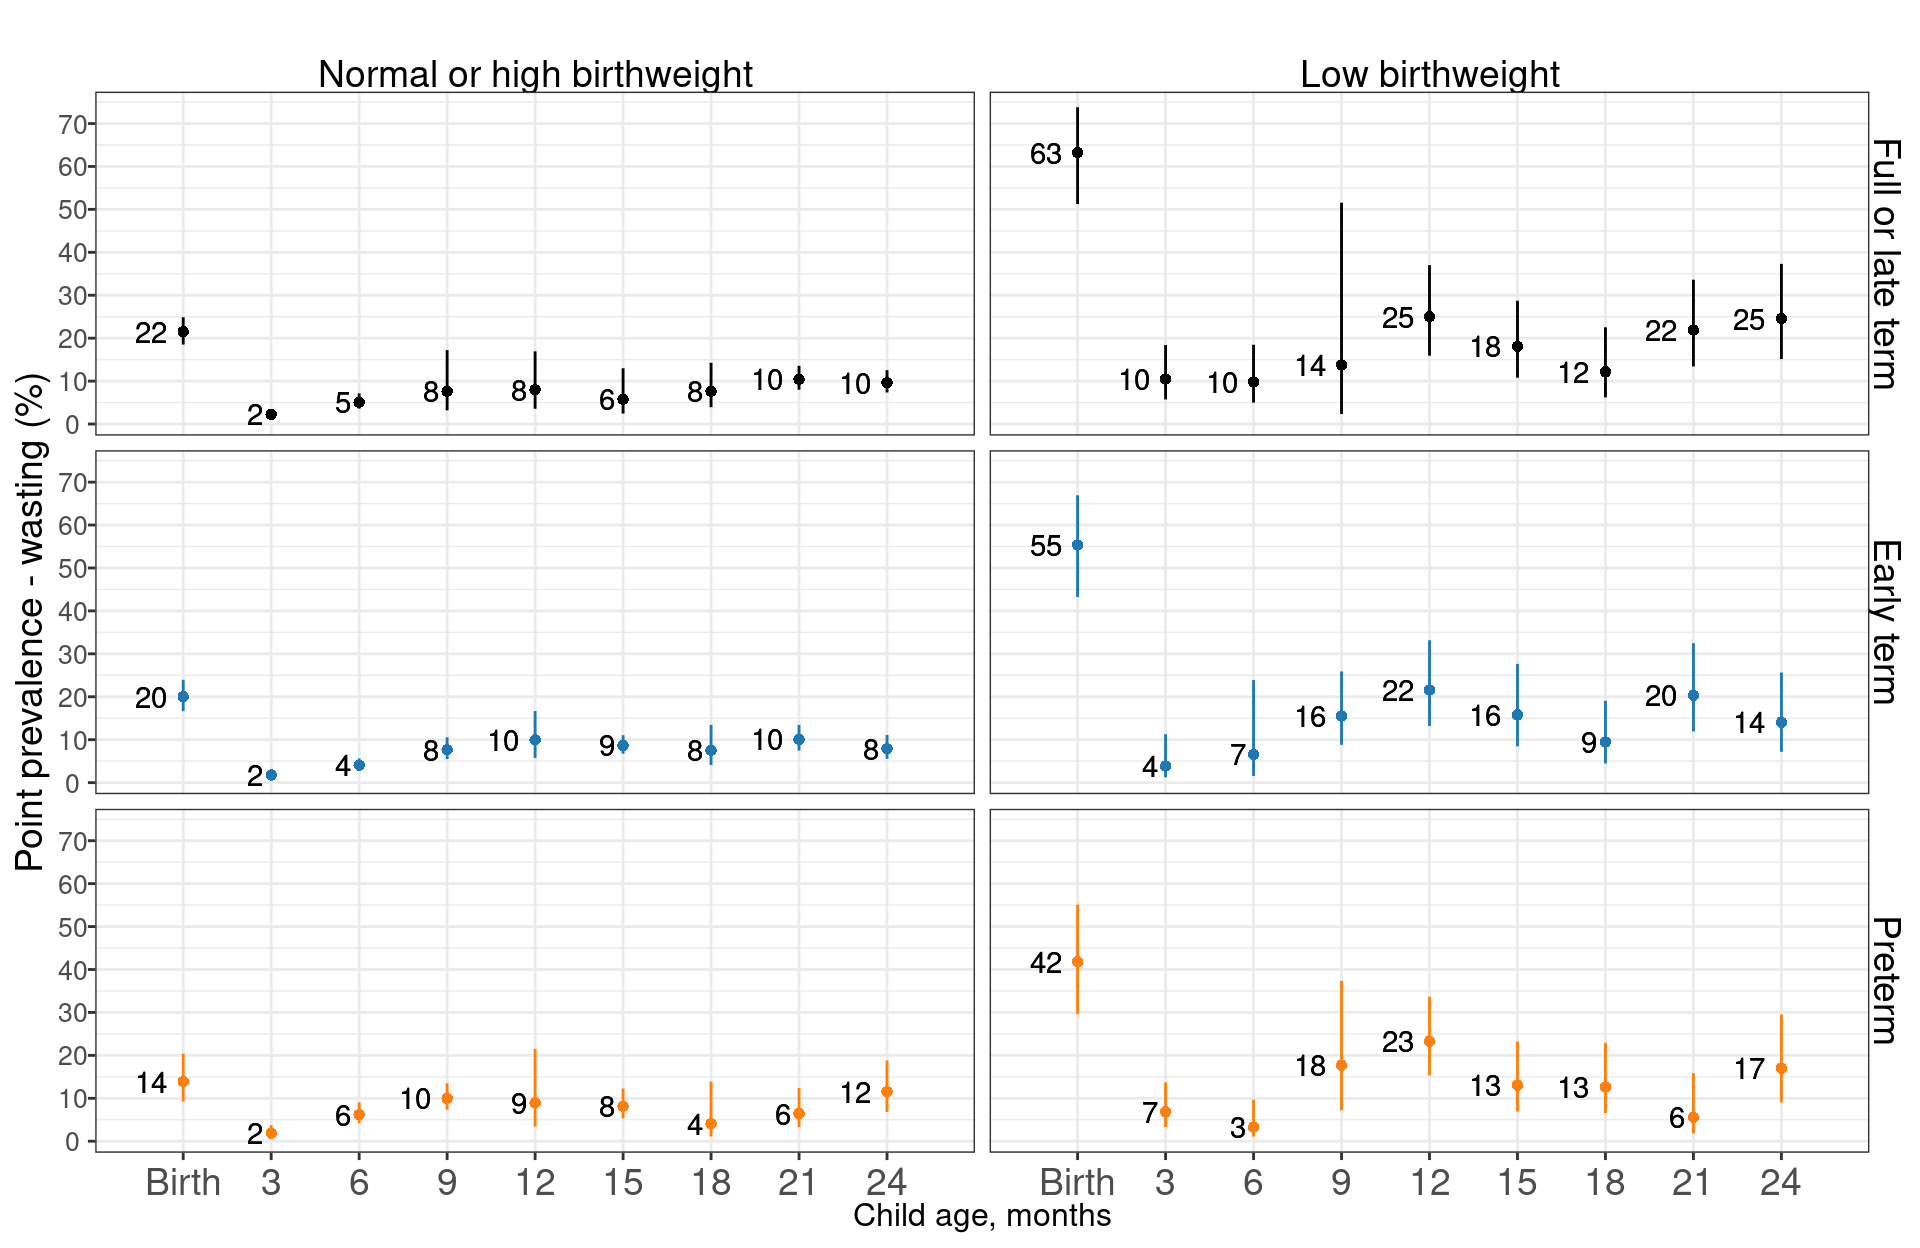
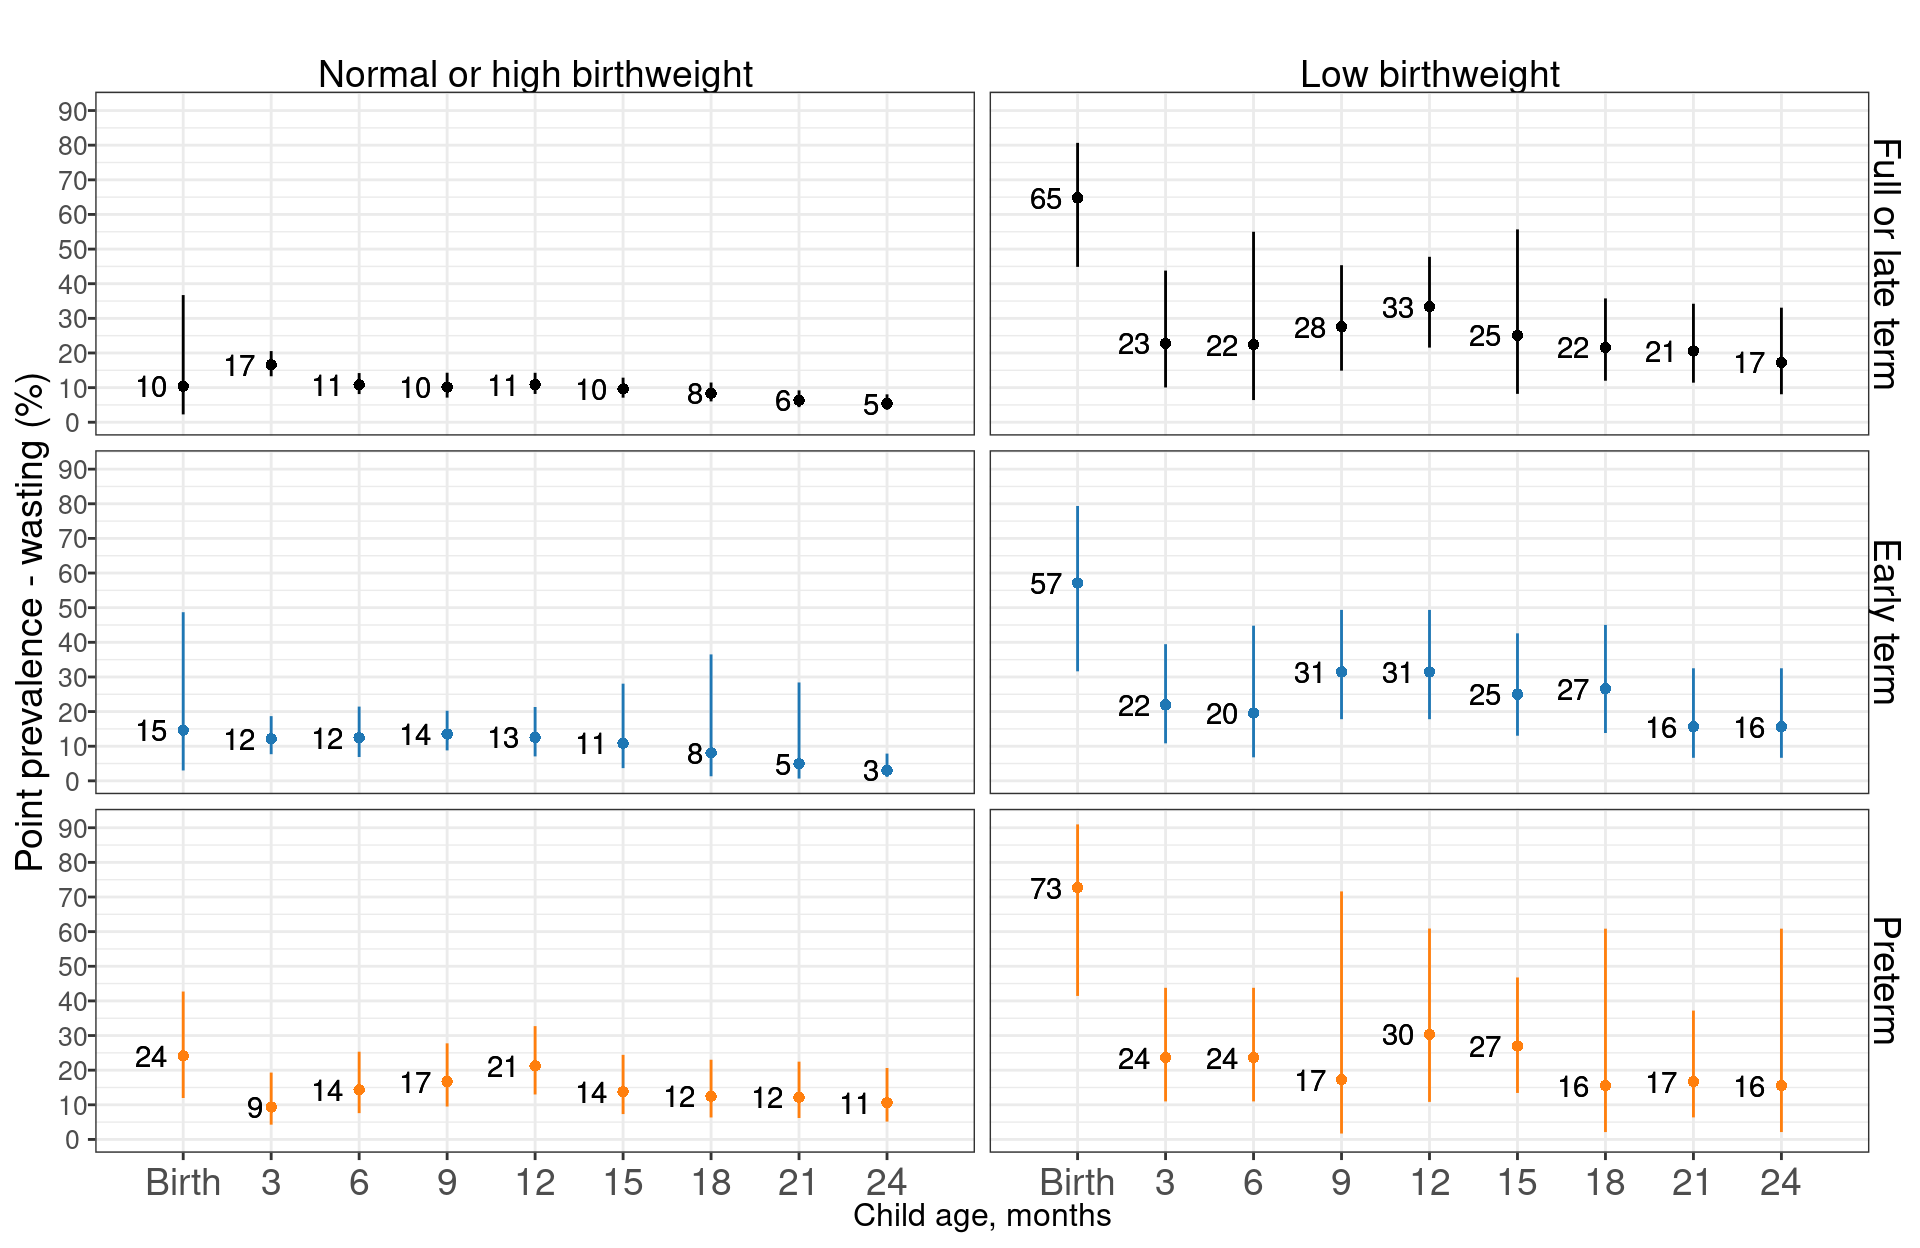
10.4.3 Age-specific prevalence of wasting, stratified by birthweight and gestational age
10.4.3.1 Overall
10.4.3.2 African cohorts
10.4.3.3 South Asian cohorts
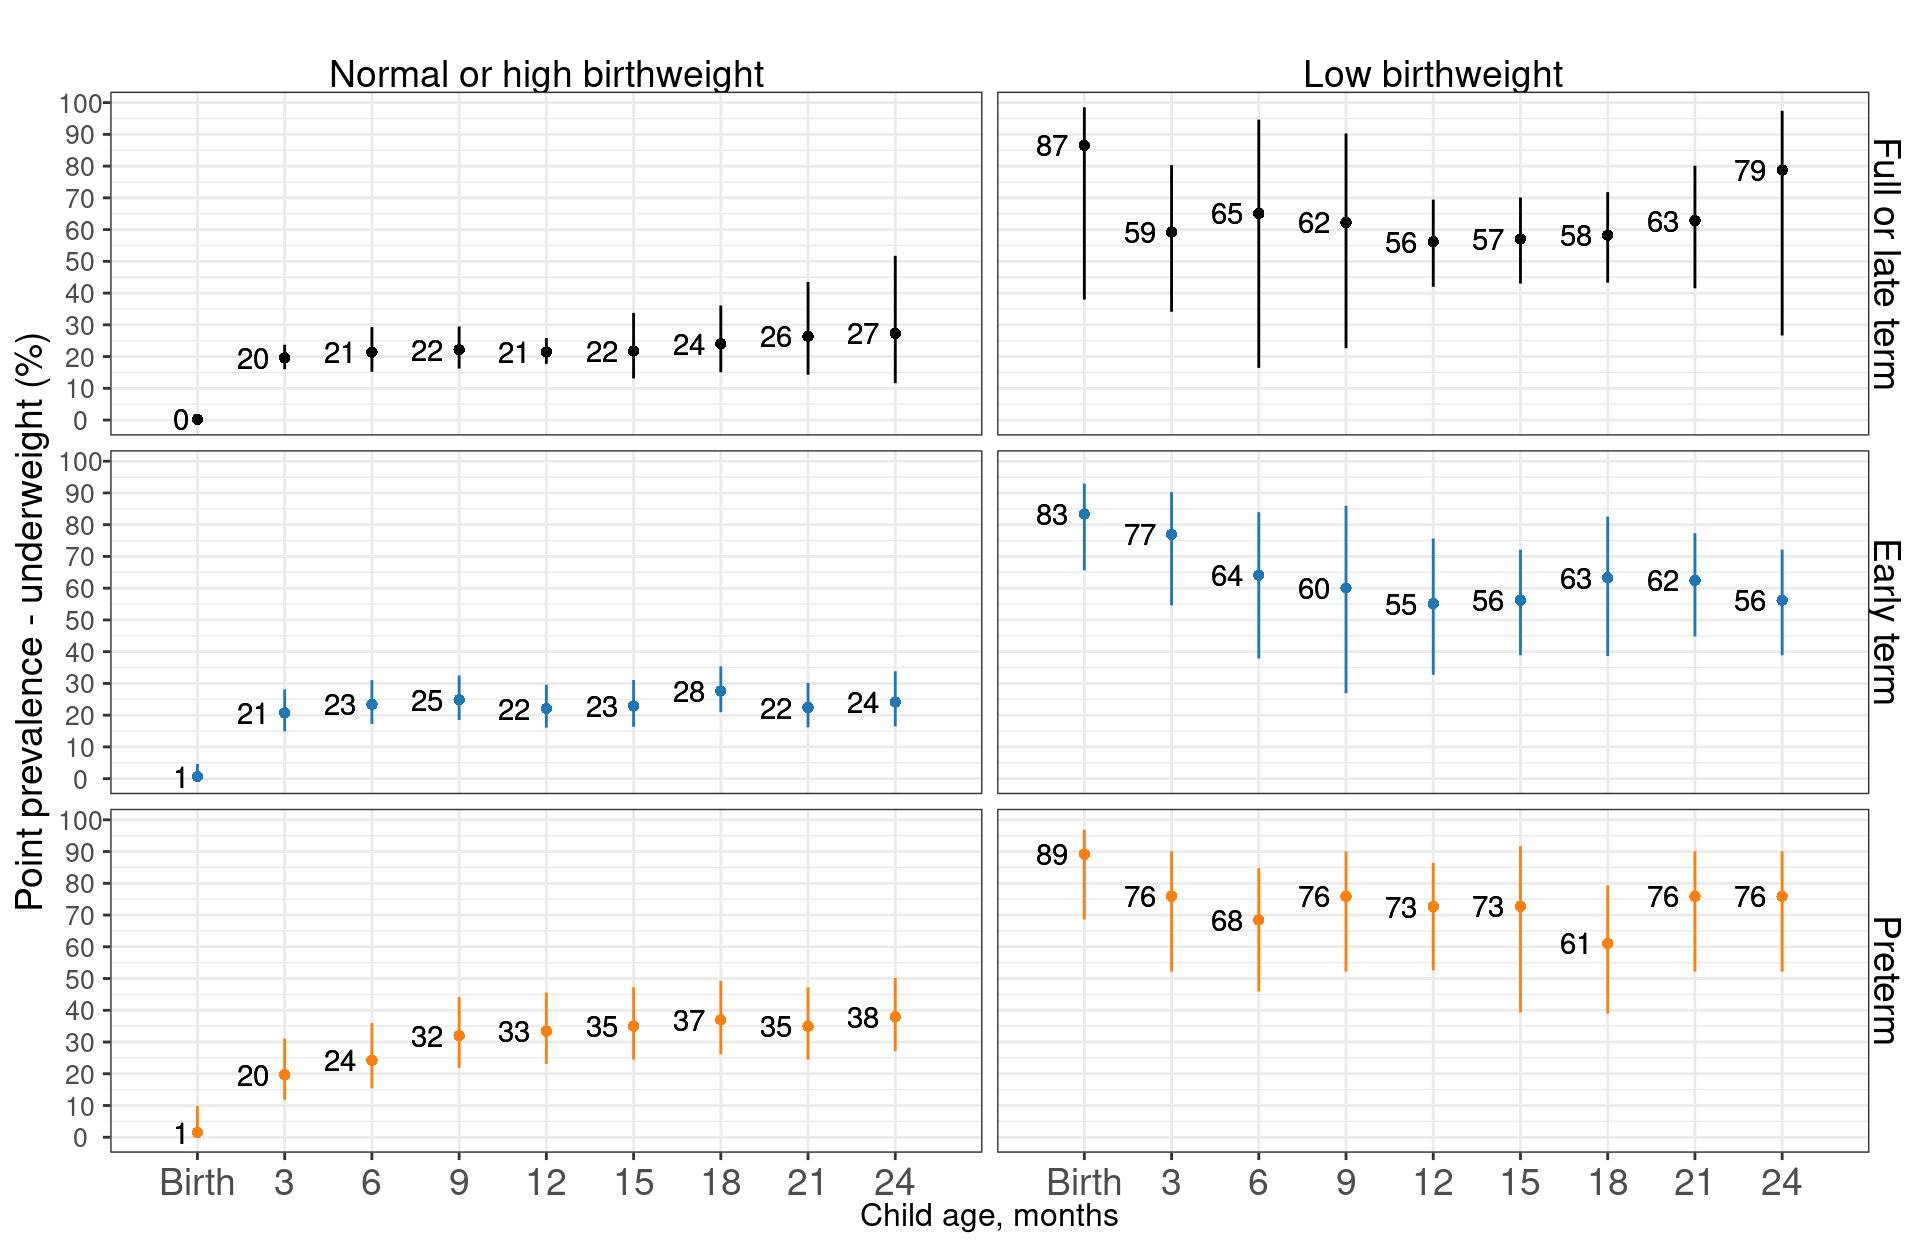
10.5 Prevalence of underweight
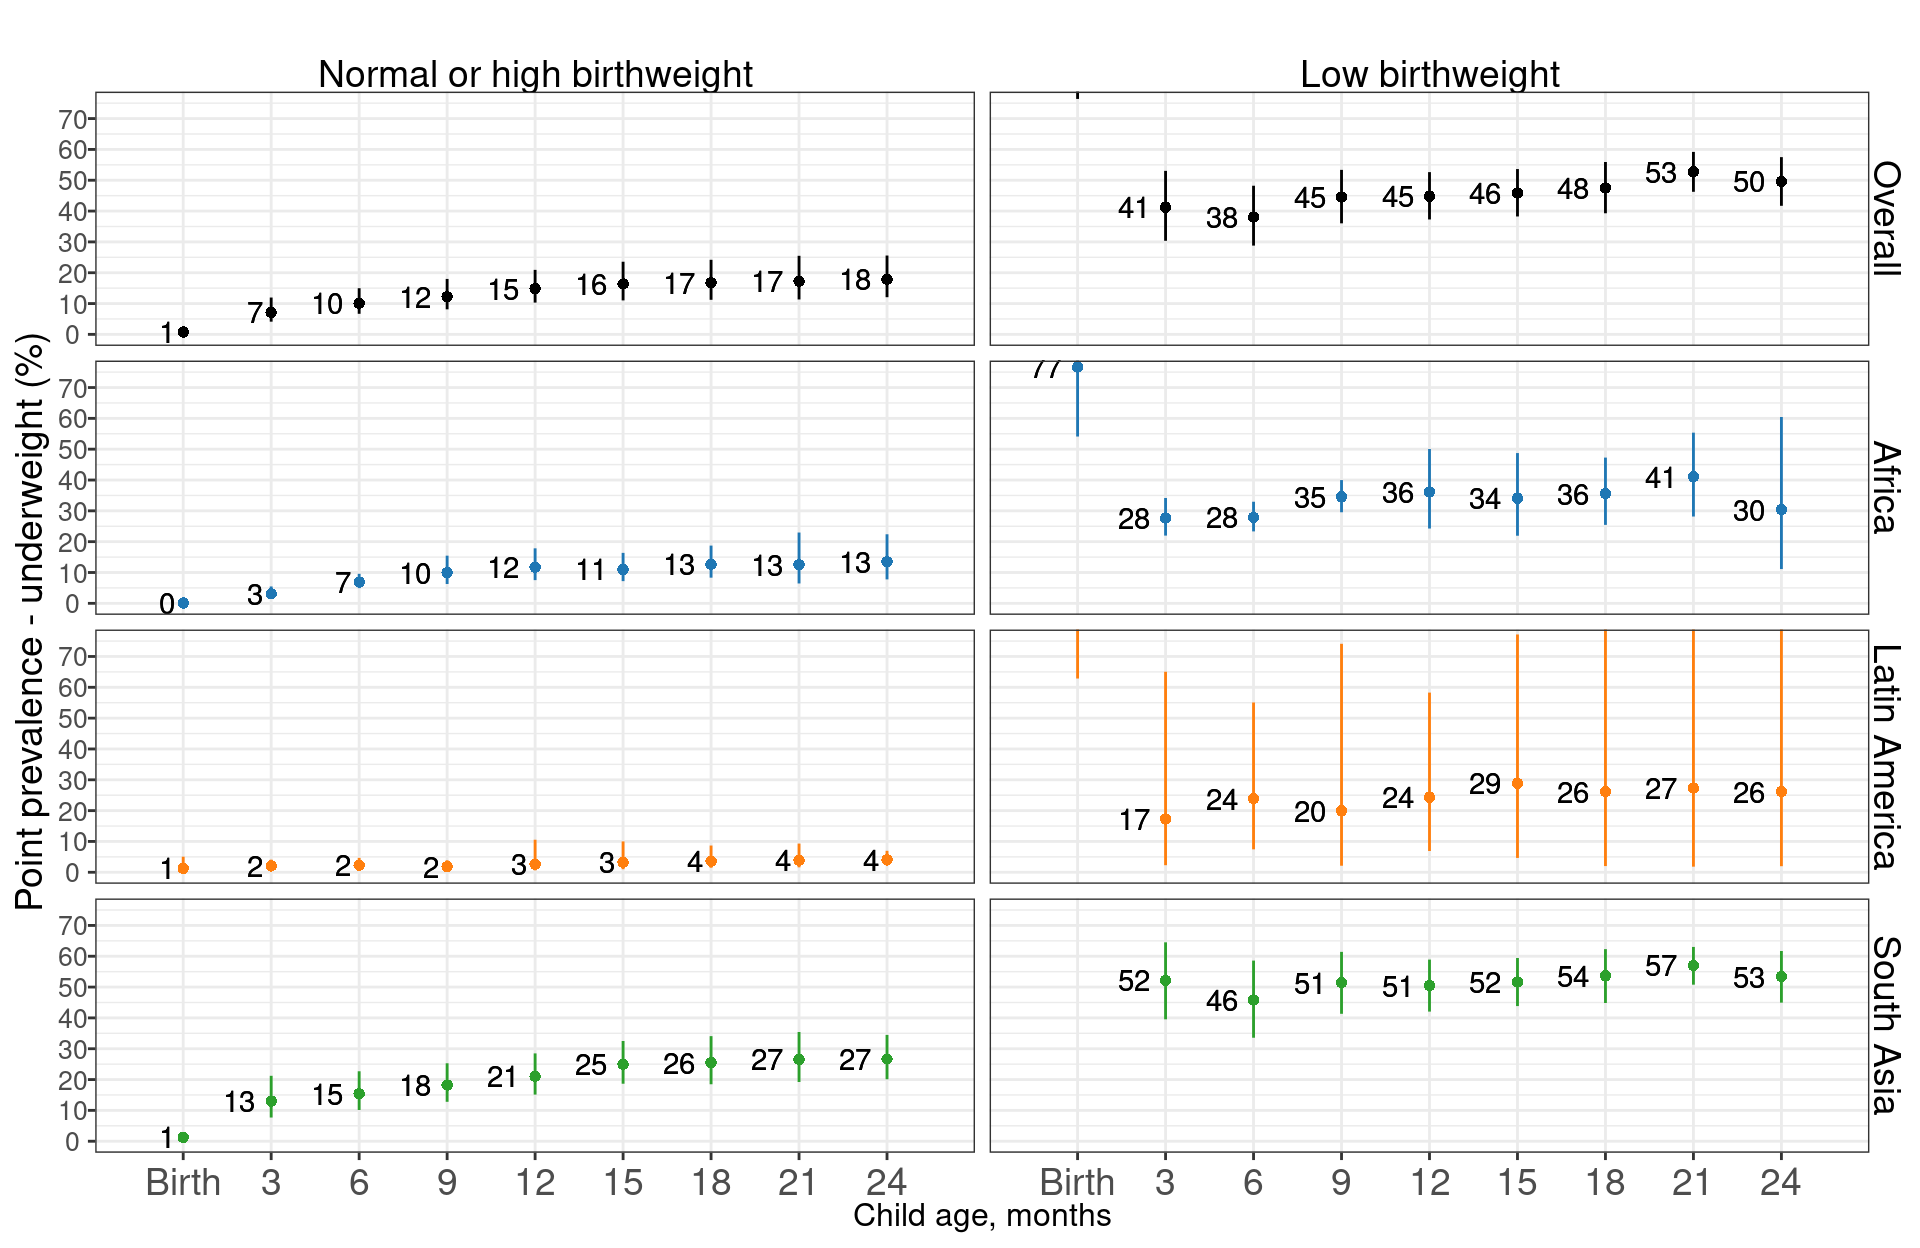
10.5.1 Age-specific prevalence of underweight, stratified by birthweight
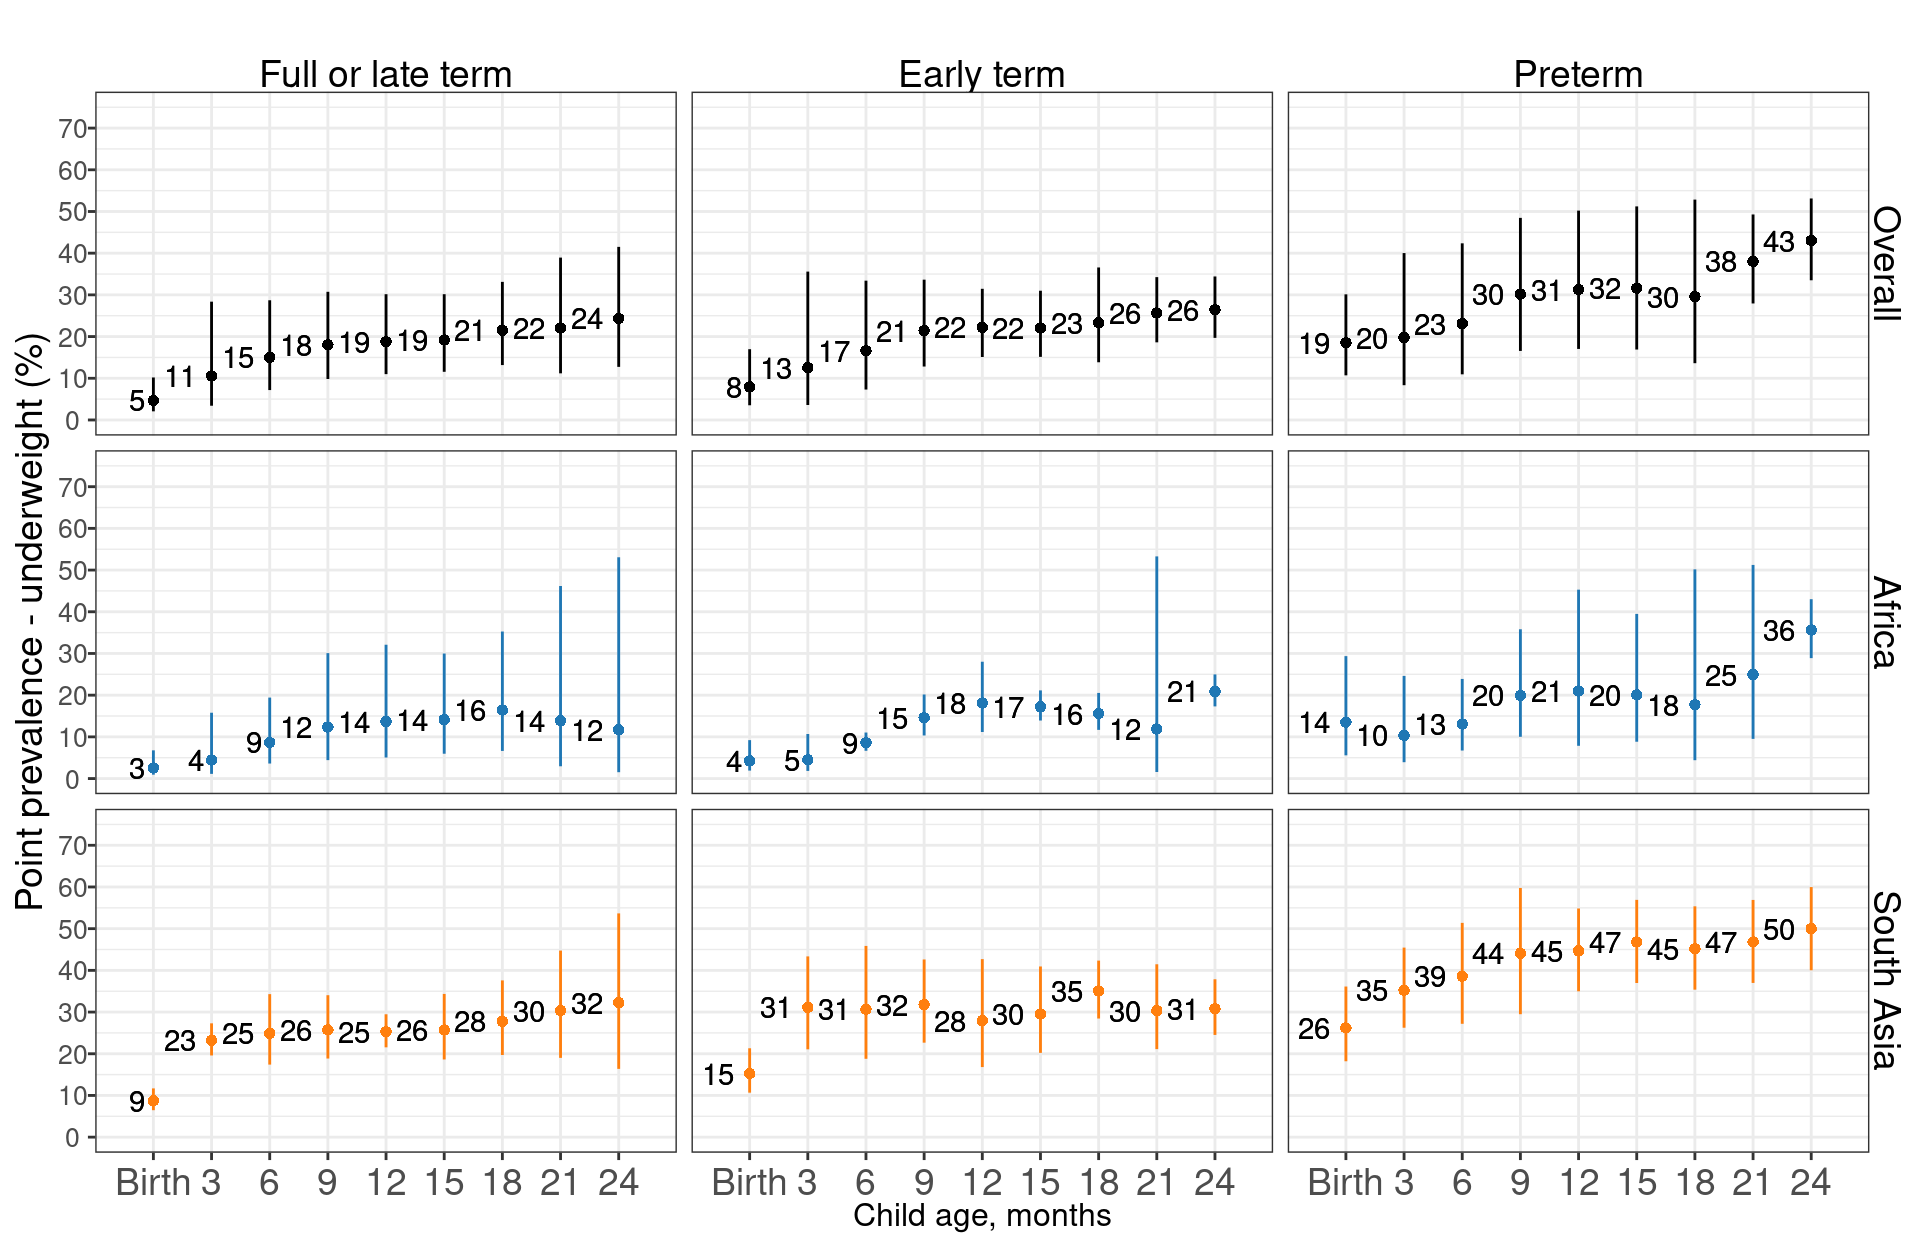
10.5.2 Age-specific prevalence of underweight, stratified by gestational age
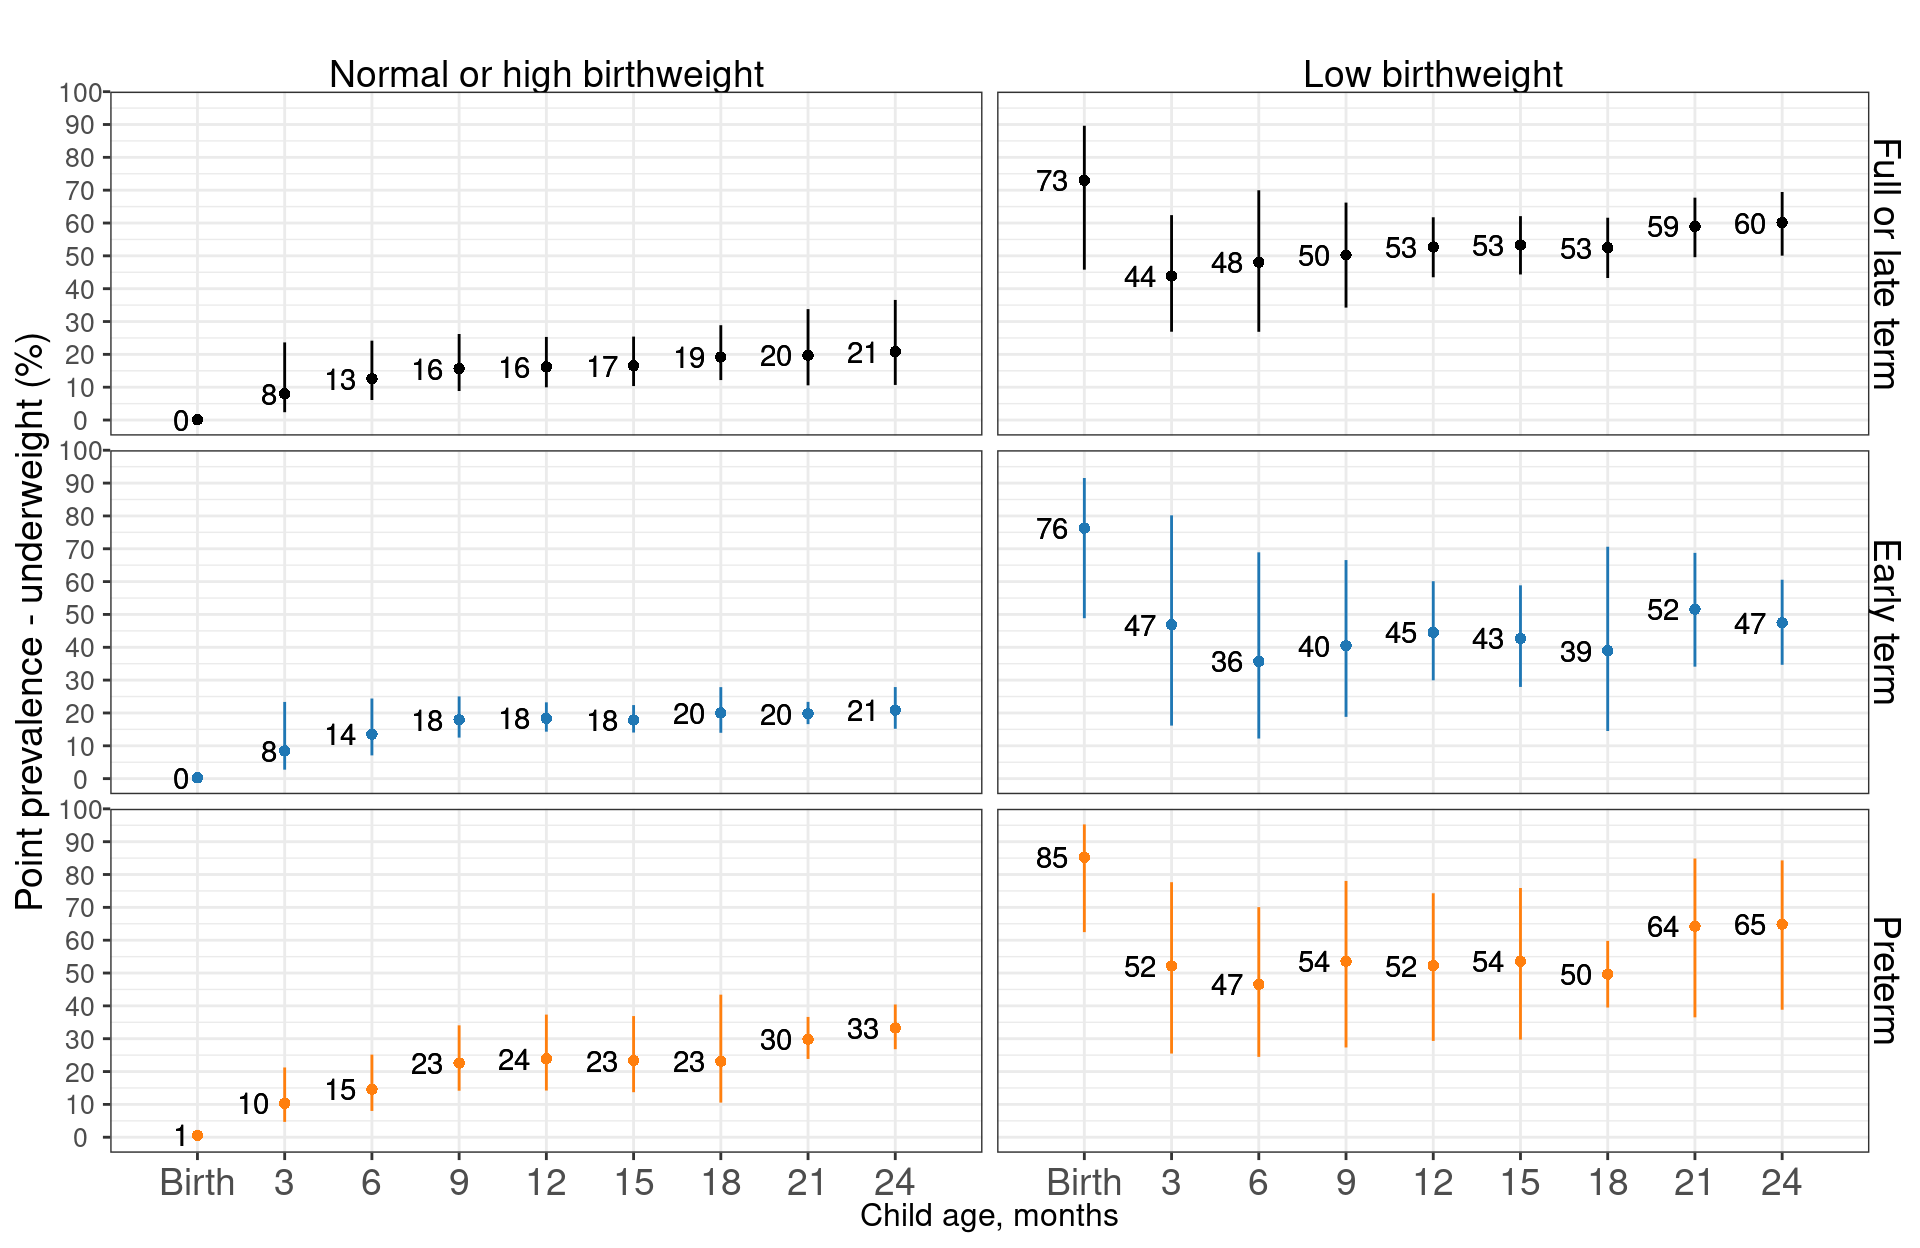
10.5.3 Age-specific prevalence of underweight, stratified by birthweight and gestational age
10.5.3.1 Overall
10.5.3.2 African cohorts
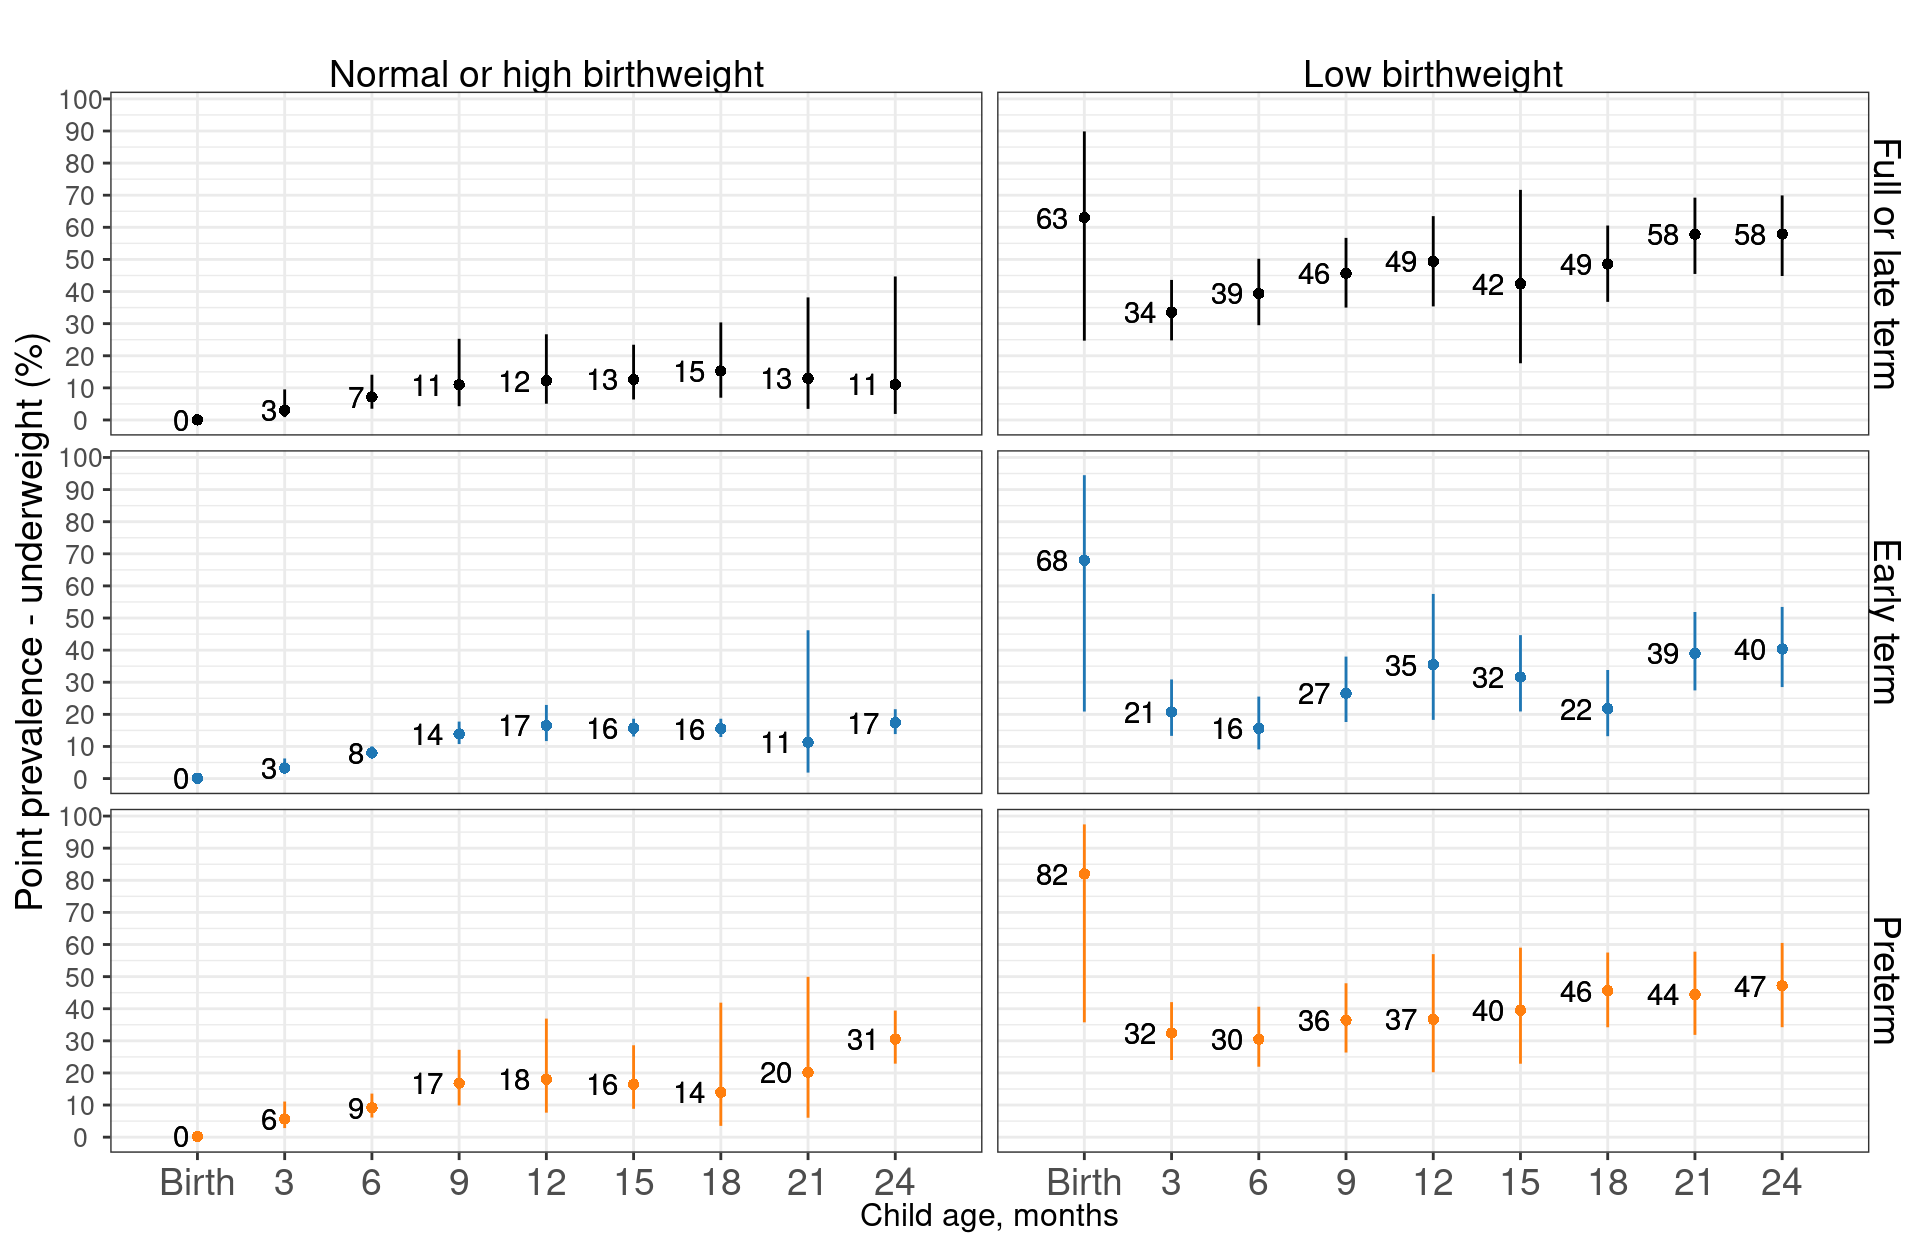
10.5.3.3 South Asian cohorts