Causes and Consequences Supplementary Information
1
Overview
2
Heatmaps
2.1
Overview
2.2
Heatmap of significance of estimates, region stratified
2.3
Heatmap of significance of estimates pooled using fixed effects
2.4
Heatmap of significance of estimate, unadjusted
3
Growth velocity
3.1
Overview
3.2
Age-stratified population attributable differences in change in length-for-age Z-scores over 3-month age bands.
3.3
Age-stratified population attributable differences in change in weight-for-age Z-scores over 3-month age bands.
3.4
Age-stratified population attributable differences in change in child length over 3-month age bands.
3.5
Age-stratified population attributable differences in change in child weight over 3-month age bands.
4
Sensitivity analysis using fixed effects
4.1
Overview
4.2
Primary manuscript figures recreated with estimates pooled using fixed effects
5
Unadjusted Population Attributable Difference plots
5.1
Overview
5.2
Age-stratified population attributable differences in length-for-age Z-scores, pooled using fixed effects models.
5.3
Age-stratified population attributable differences in weight-for-length Z-scores, pooled using fixed effects models.
5.4
Region-stratified population attributable differences in length-for-age Z-scores, pooled using fixed effects models.
5.5
Region-stratified population attributable differences in weight-for-length Z-scores, pooled using fixed effects models.
6
Sensitivity spline plots
6.1
Overview
6.1.1
Primary spline figures - meta-analysis of cohort specific splines
6.1.2
Spline figures - meta-analysis of cohort specific splines, different parameters
6.1.3
Primary spline figures - Single spline fit to all the data
6.1.4
Primary spline figures - splines fit through meta-analyses of monthly means of Z-scores
7
spline-plots - all exposures
7.1
Overview
8
Regionally-stratified plots
8.1
Overview
8.2
Region and age-stratified population attributable differences in length-for-age Z-scores
8.3
Region and age-stratified population attributable differences in weight-for-length Z-scores
8.4
Region and age-stratified population attributable differences in weight-for-age Z-scores
8.5
Associations between key exposures and wasting and stunting cumulative incidence, stratified by the age of the child and by region
8.6
Associations between key exposures and growth failure of different severities, stratified by region
8.7
Adjusted differences in linear growth velocity (in centimeters) across 3-month age 624 bands, by quartile of weight-for-length z-score (WLZ) in the preceding three months, stratified by region.
9
Relative risk plots
9.1
Overview
9.1.1
Relative risks between levels of all exposures for prevalence and cumulative incidence of wasting and stunting outcomes
10
Forest plots of relative risk
11
Sensitivity to dropping PROBIT trial
11.1
Overview
11.2
Comparison of attributable differences estimated with and without the PROBIT trial
12
Mortality Sensitivity Analyses
12.1
Overview
12.1.1
Comparisons of associations between early growth failure and different ages of mortality
12.1.2
Comparisons of associations between early growth failure and different ages of mortality, pooled using fixed effects
12.1.3
Comparisons of associations between early growth failure and different ages of mortality, dropping biyearly-measured cohorts
12.1.4
Comparisons of associations between early growth failure and mortality and serious growth failure, stratified by region
12.1.5
Comparisons of associations between early growth failure and mortality and serious growth failure, pooled using fixed effects
13
Directed Acyclic Diagrams (DAGs)
13.1
Overview
13.2
Simplified example DAG:
13.3
DAG used: Association between maternal weight and child growth faltering
13.4
Table of Adjustment Covariates
14
Population intervention effects on weight-for-age Z-scores
14.0.1
Figure
15
Complete-Case Sensitivity Analyses
15.1
Overview
15.1.1
Heatmap of covariate missingness by study
15.1.2
Sensitivity analysis to complete case versus median/mode imputed analyses
Published with bookdown
Supplement to Causes and Consequences of Child Growth Failure in Low- and Middle-income Countries
Chapter 6
Sensitivity spline plots
6.1
Overview
Purpose:
Interpretation:
Implications:
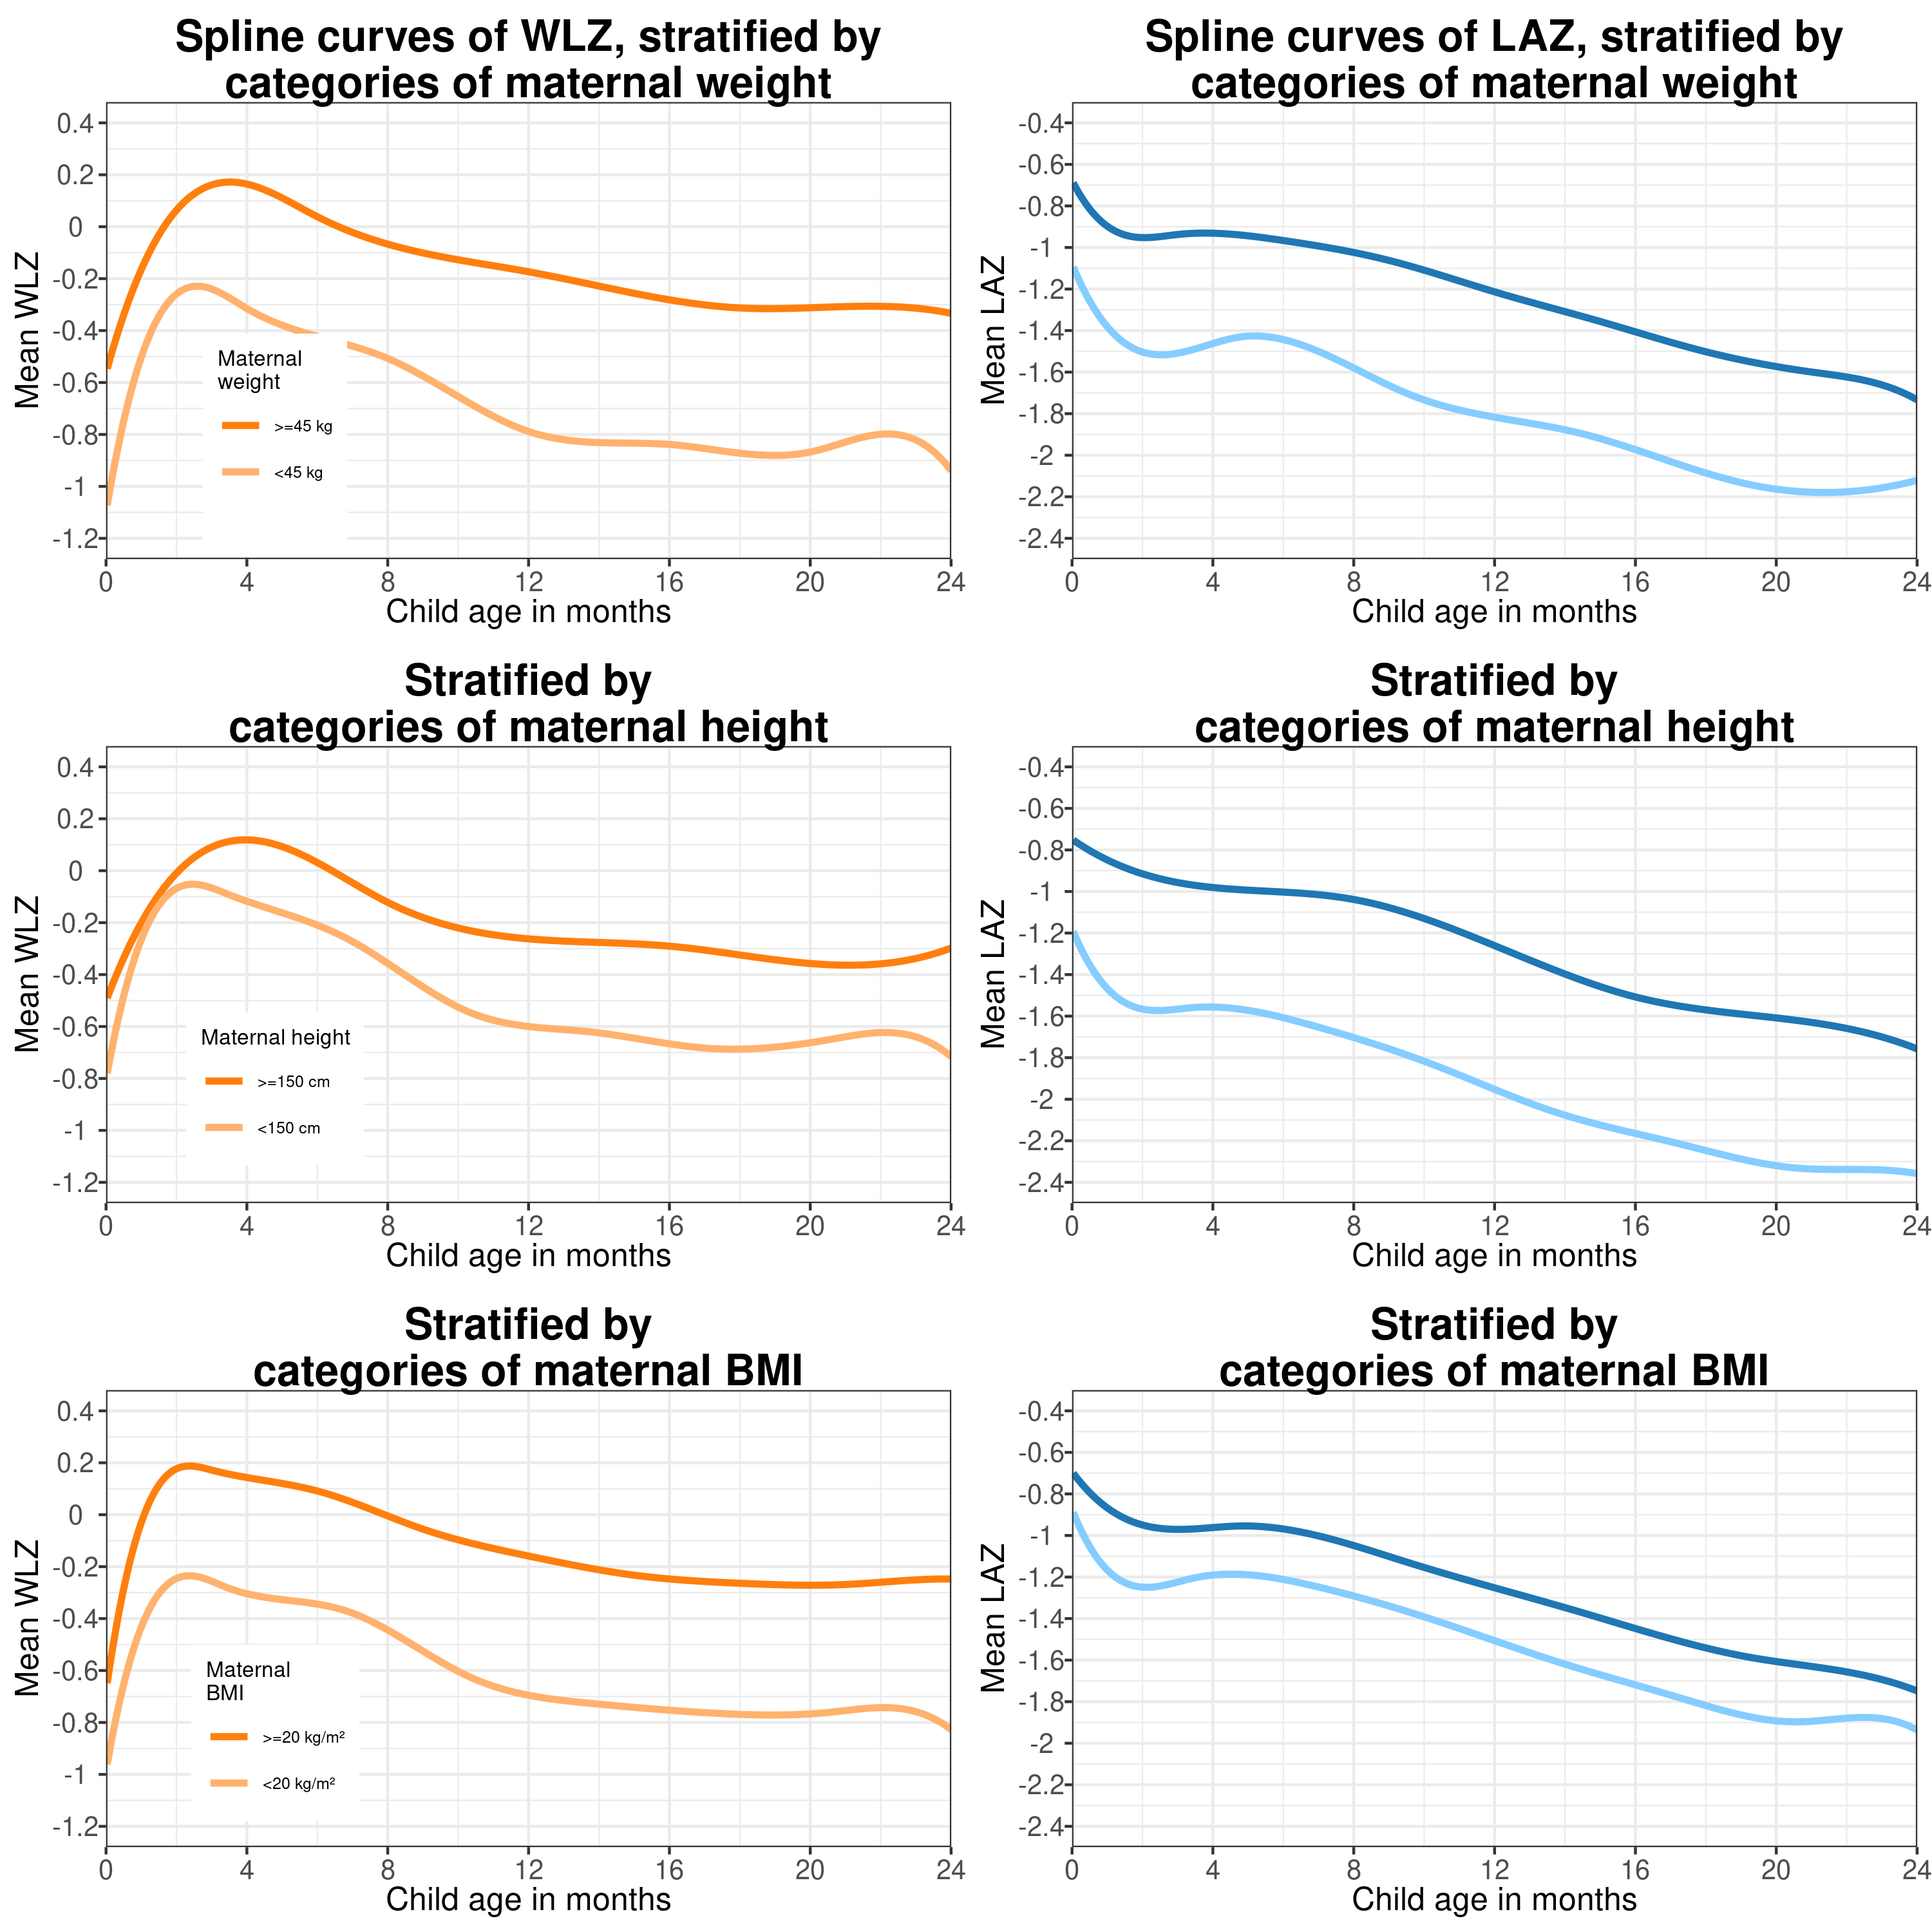
6.1.1
Primary spline figures - meta-analysis of cohort specific splines
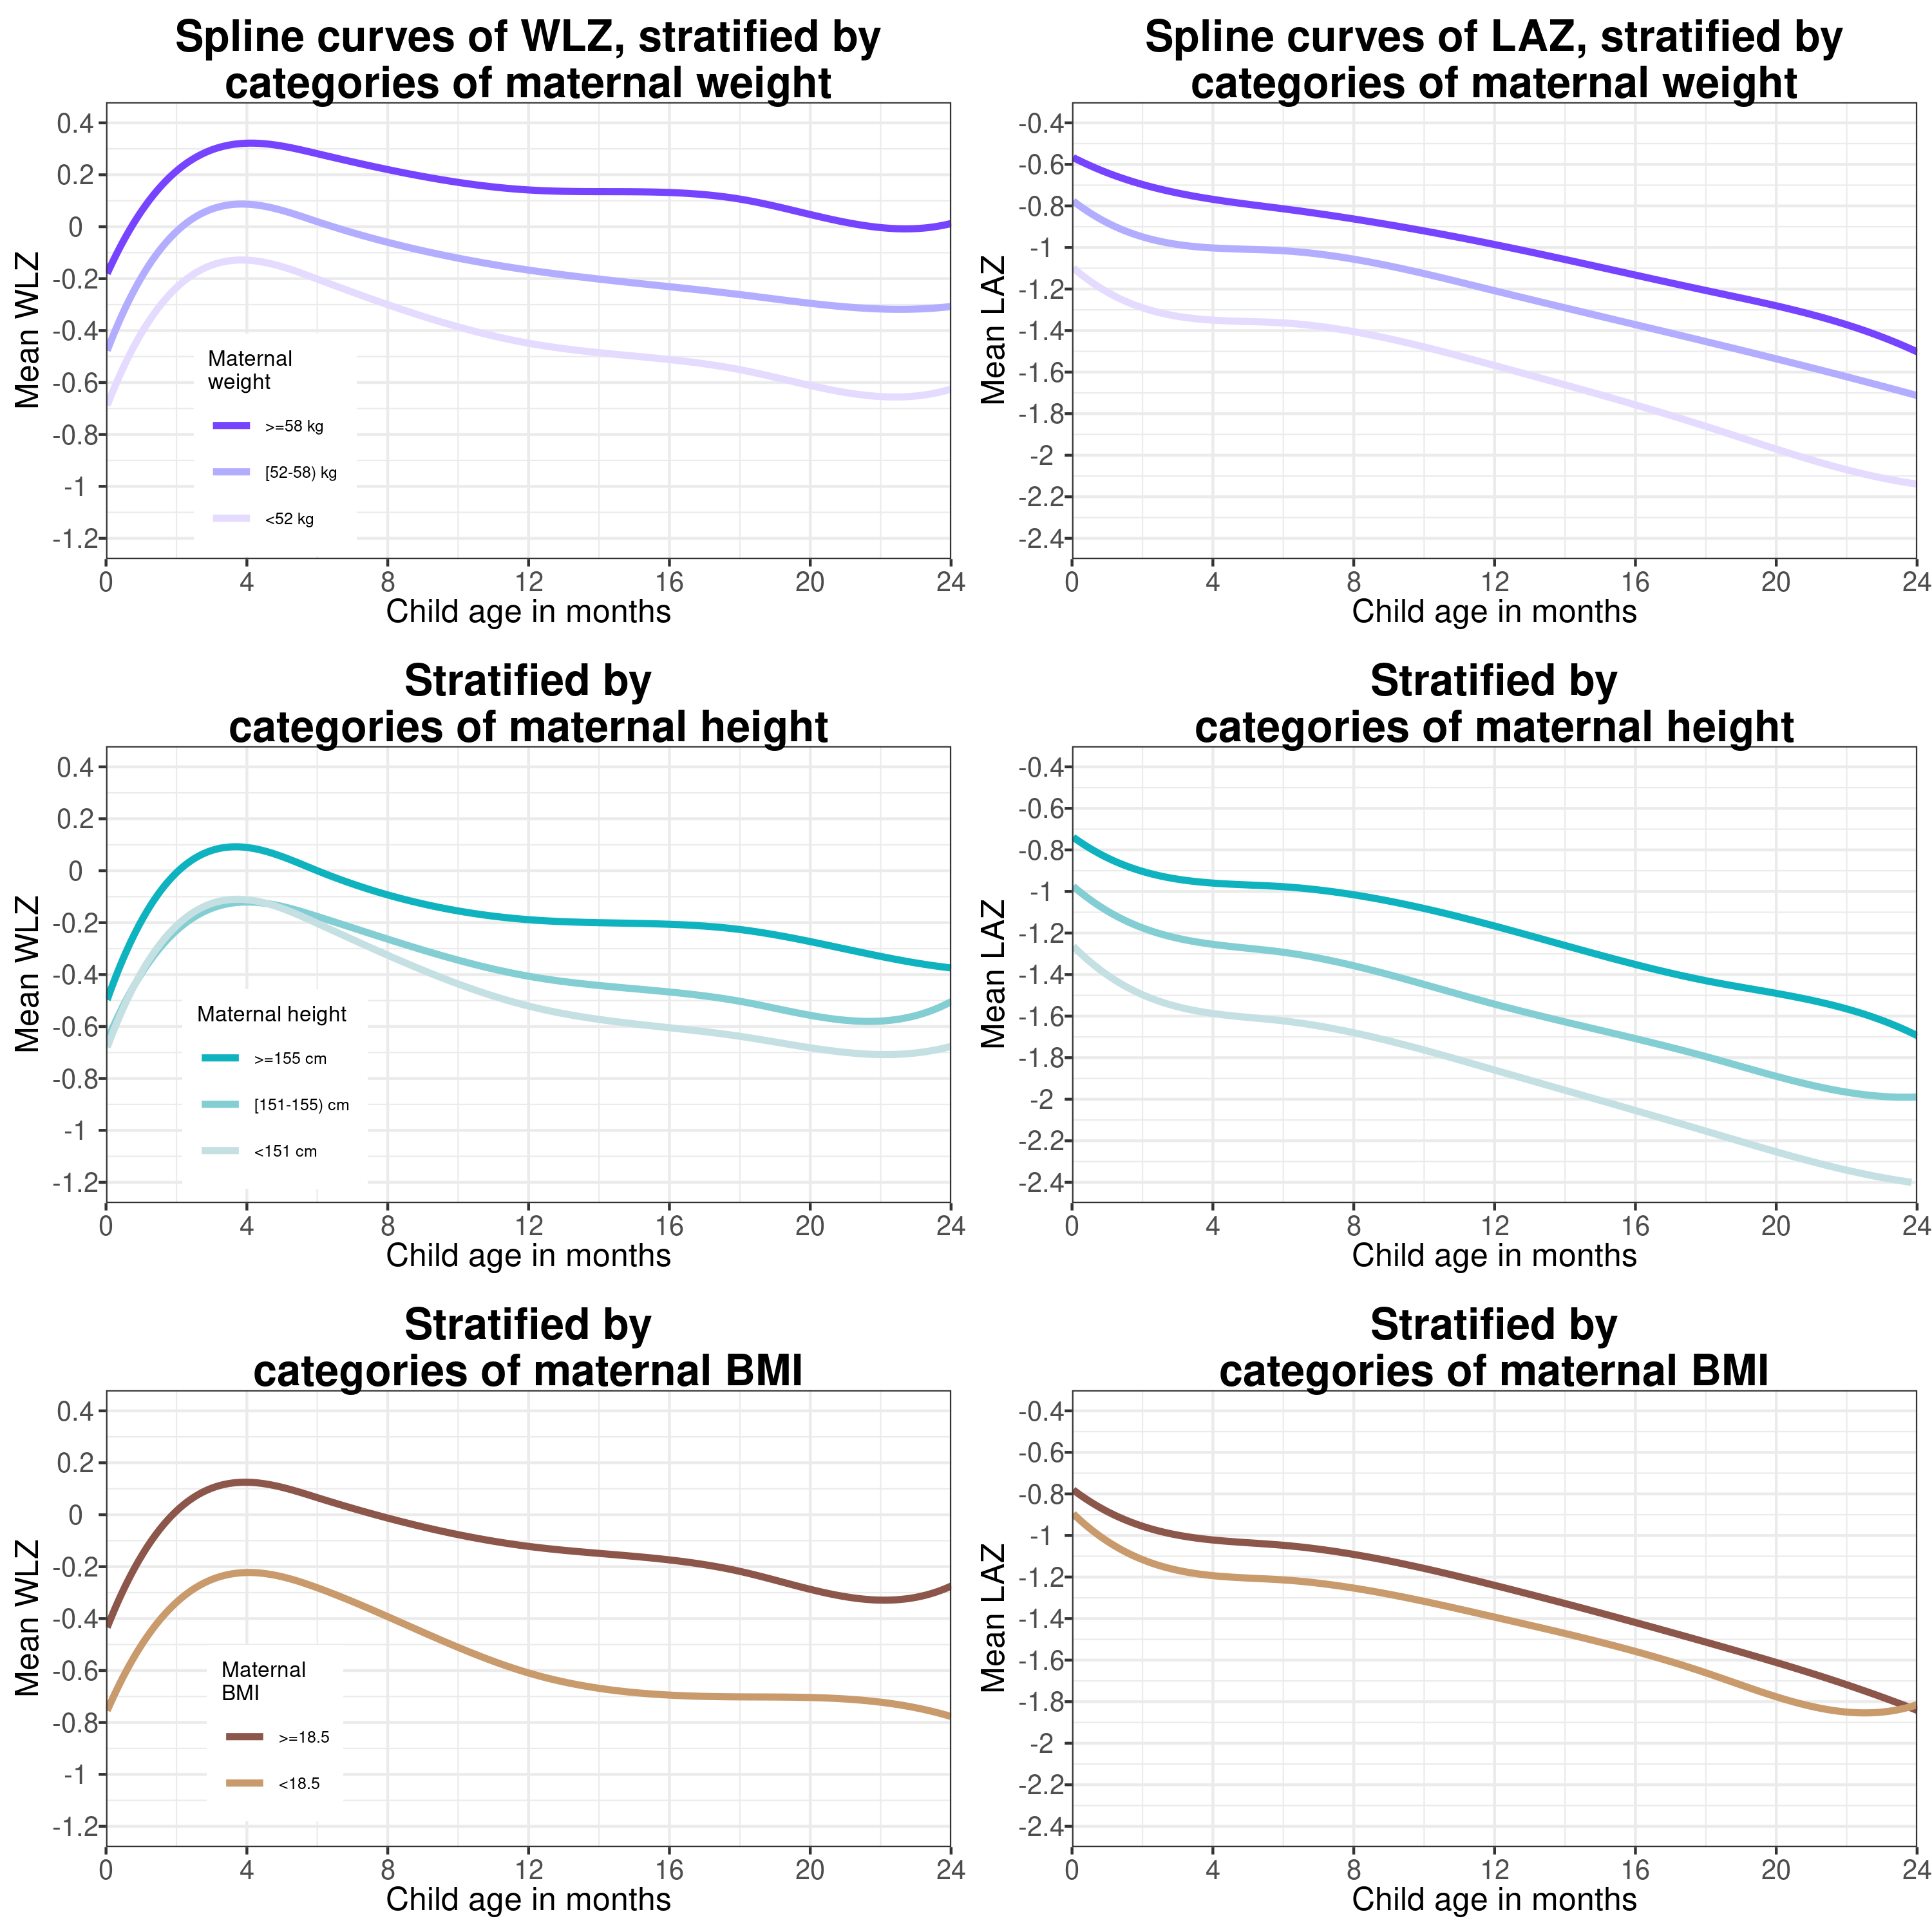
6.1.2
Spline figures - meta-analysis of cohort specific splines, different parameters
Centered at age = 1 days and with 6 degrees of freedom
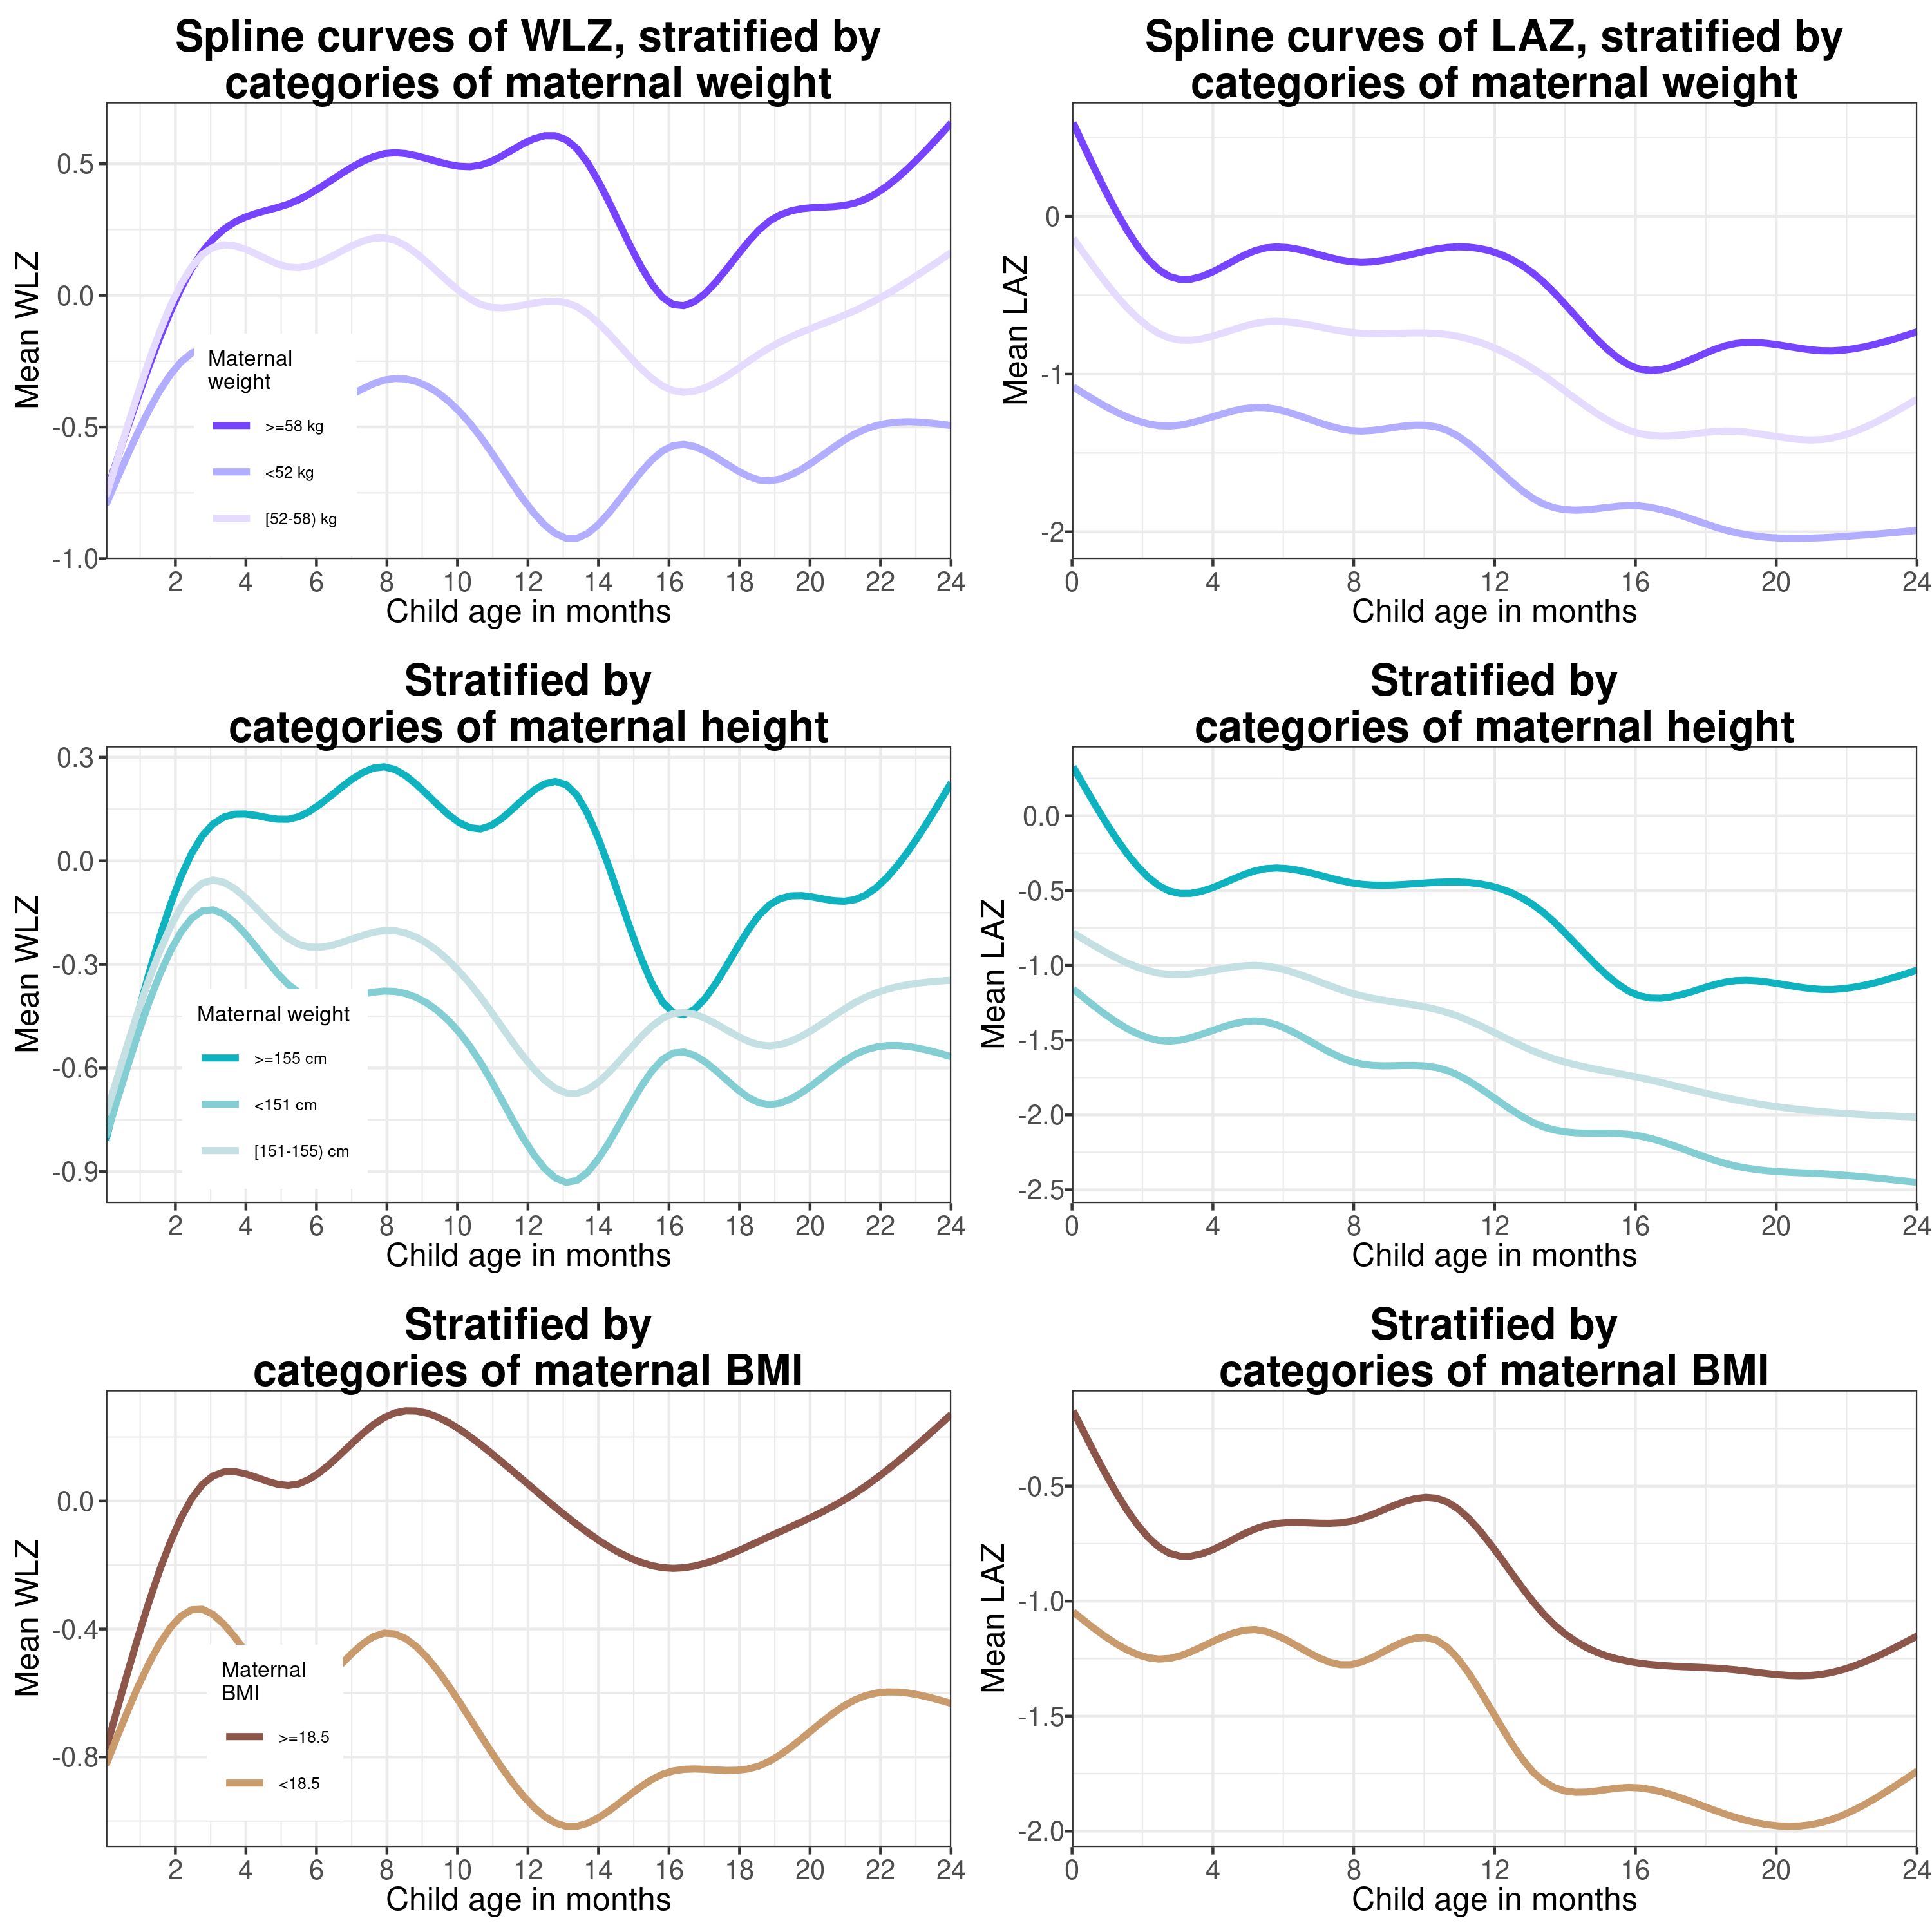
6.1.3
Primary spline figures - Single spline fit to all the data
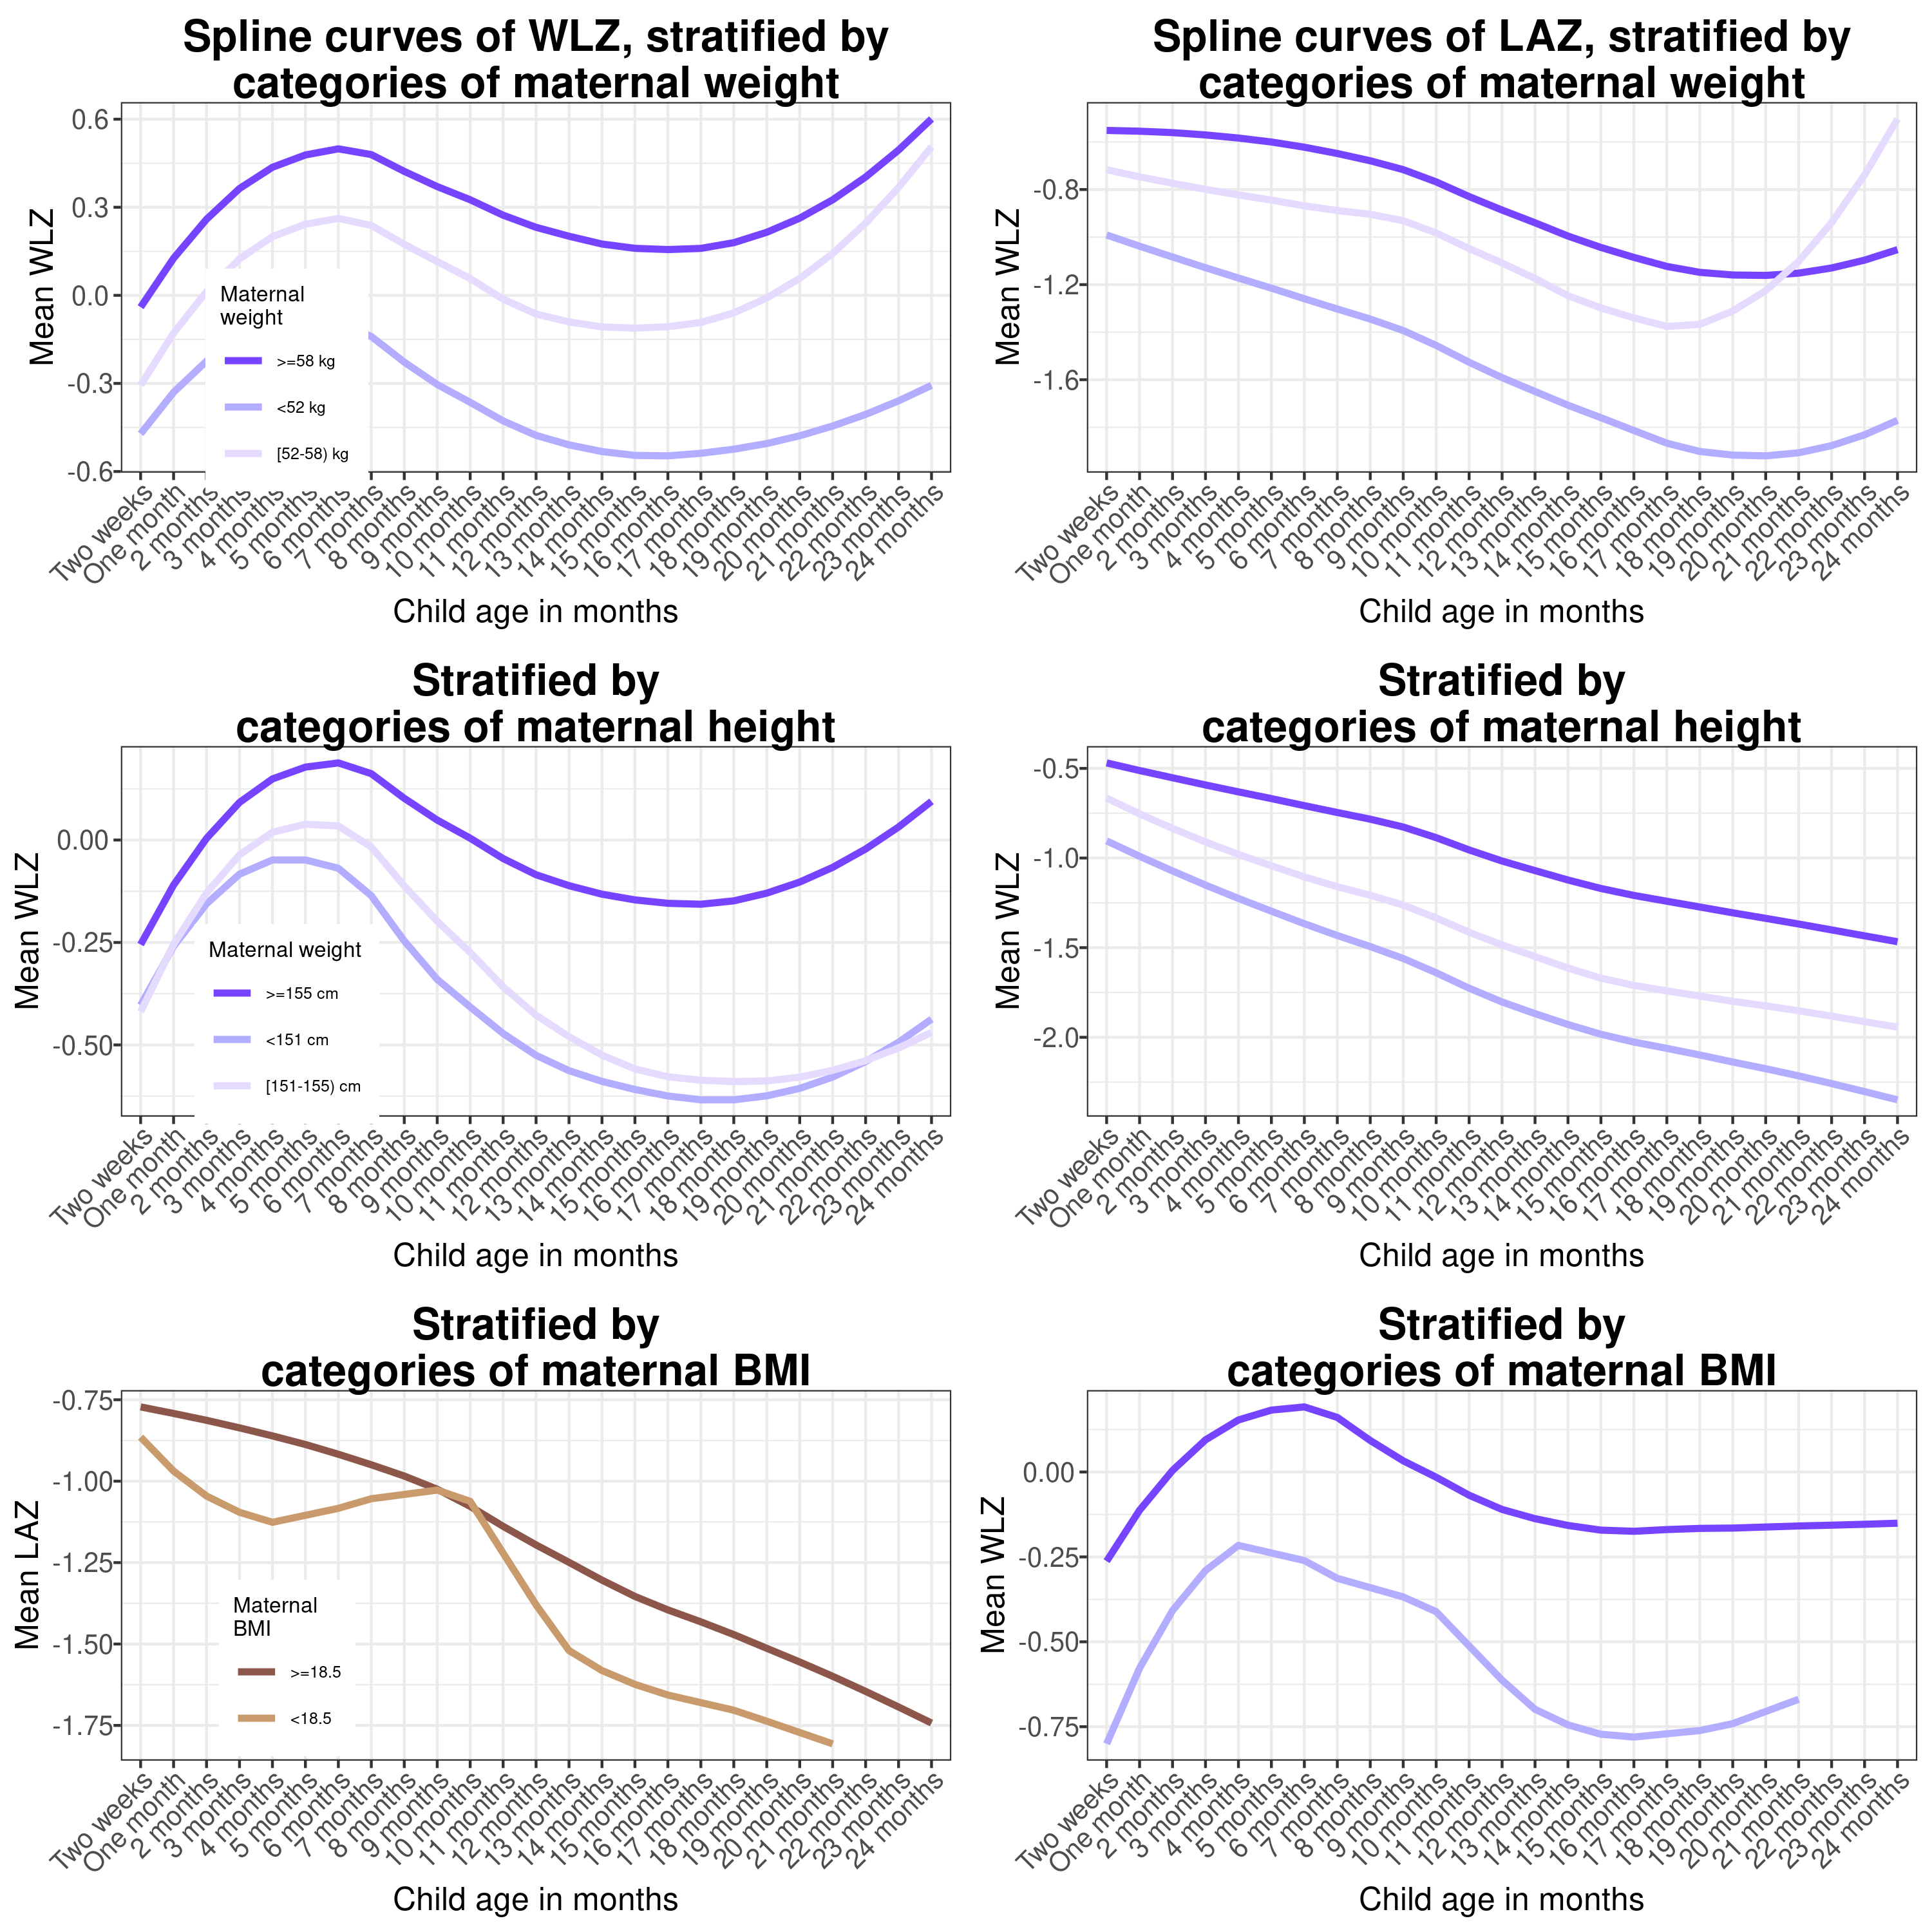
6.1.4
Primary spline figures - splines fit through meta-analyses of monthly means of Z-scores