Chapter 9 Regionally-stratified plots
9.1 Overview
Purpose: Extended data figures 3-8 show age or regionally stratified plots of PIE of risk factors and child growth Z-scores. This page shows age and regionally stratified plots to allow comparisons of differences across regions in age-specific differences in associations between exposures and child growth faltering. Interpretation: There are regional variations in the rank-ordering of exposures by age and the magnitude of associations, but no unexpected findings obscured by pooling age-specific estimates over regions. Variations in estimates arise from different study populations, different numbers of studies measuring exposures in each region and at each age, and heterogeneity in the study-specific estimates underlying the random-effects pooled estimates. Implications: We did not identify important regionally-specific patterns in age-specific exposure-growth faltering associations that were missed by using regionally-pooled estimates in the supplemental figures.
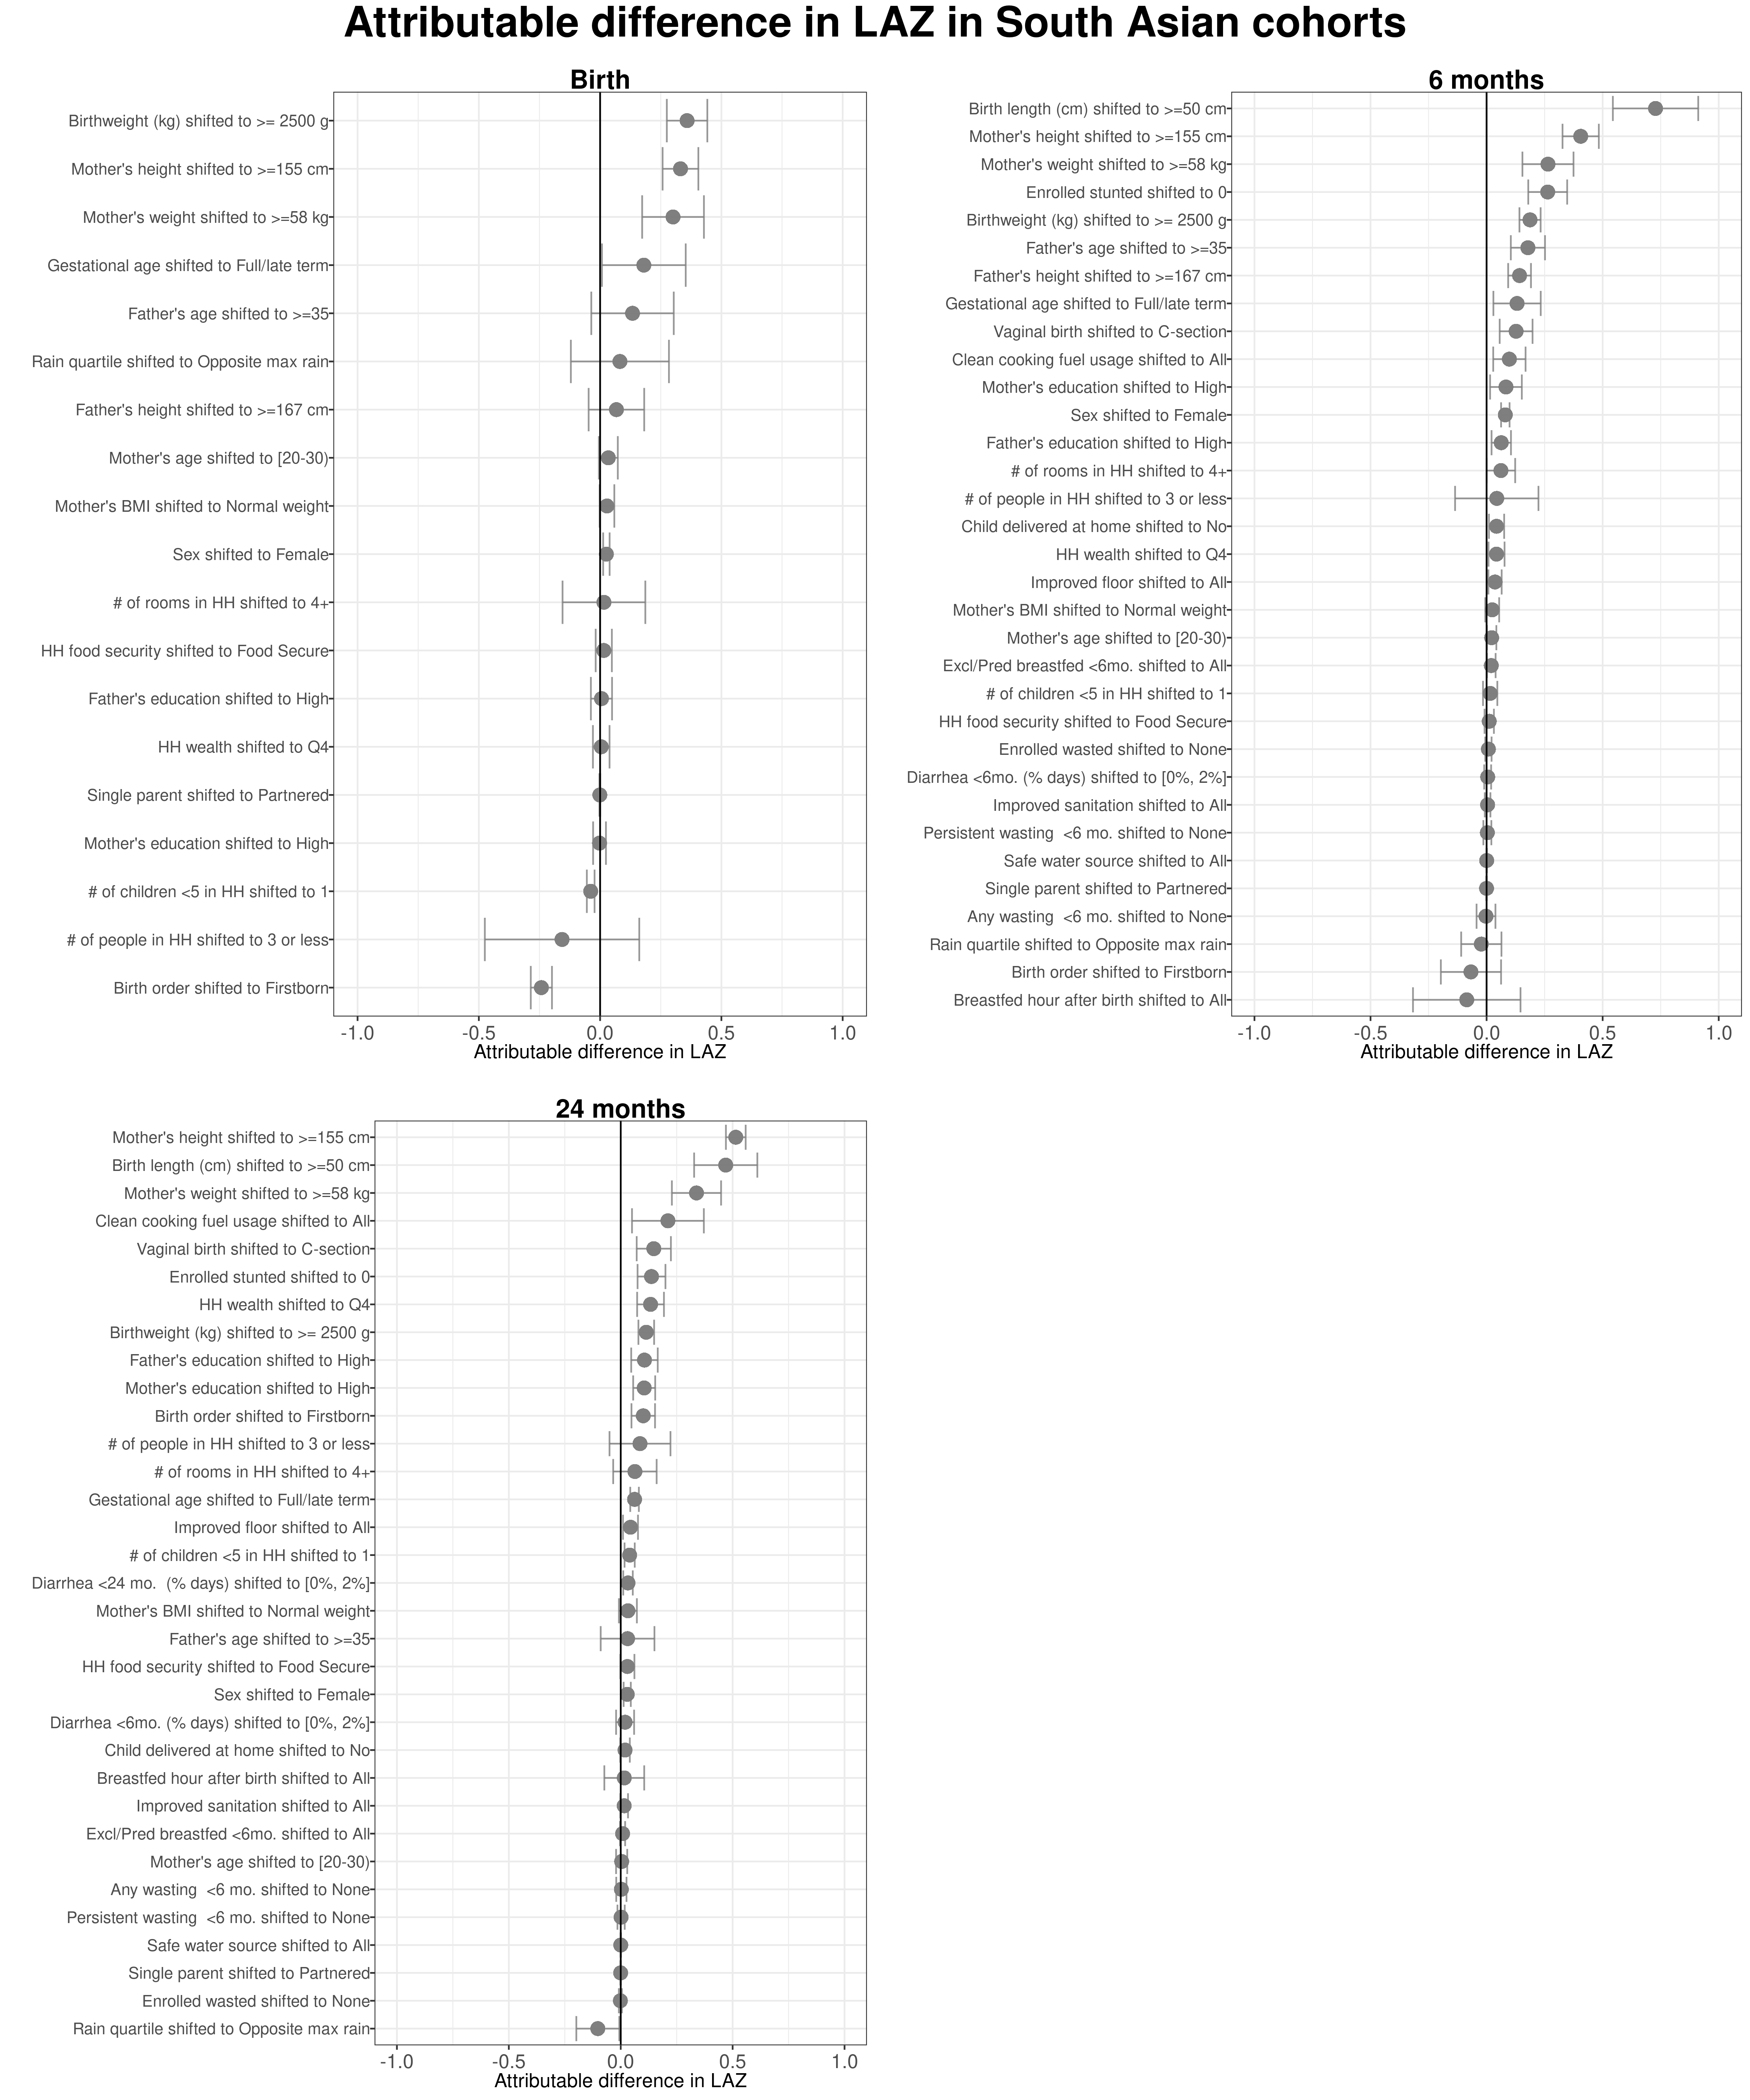
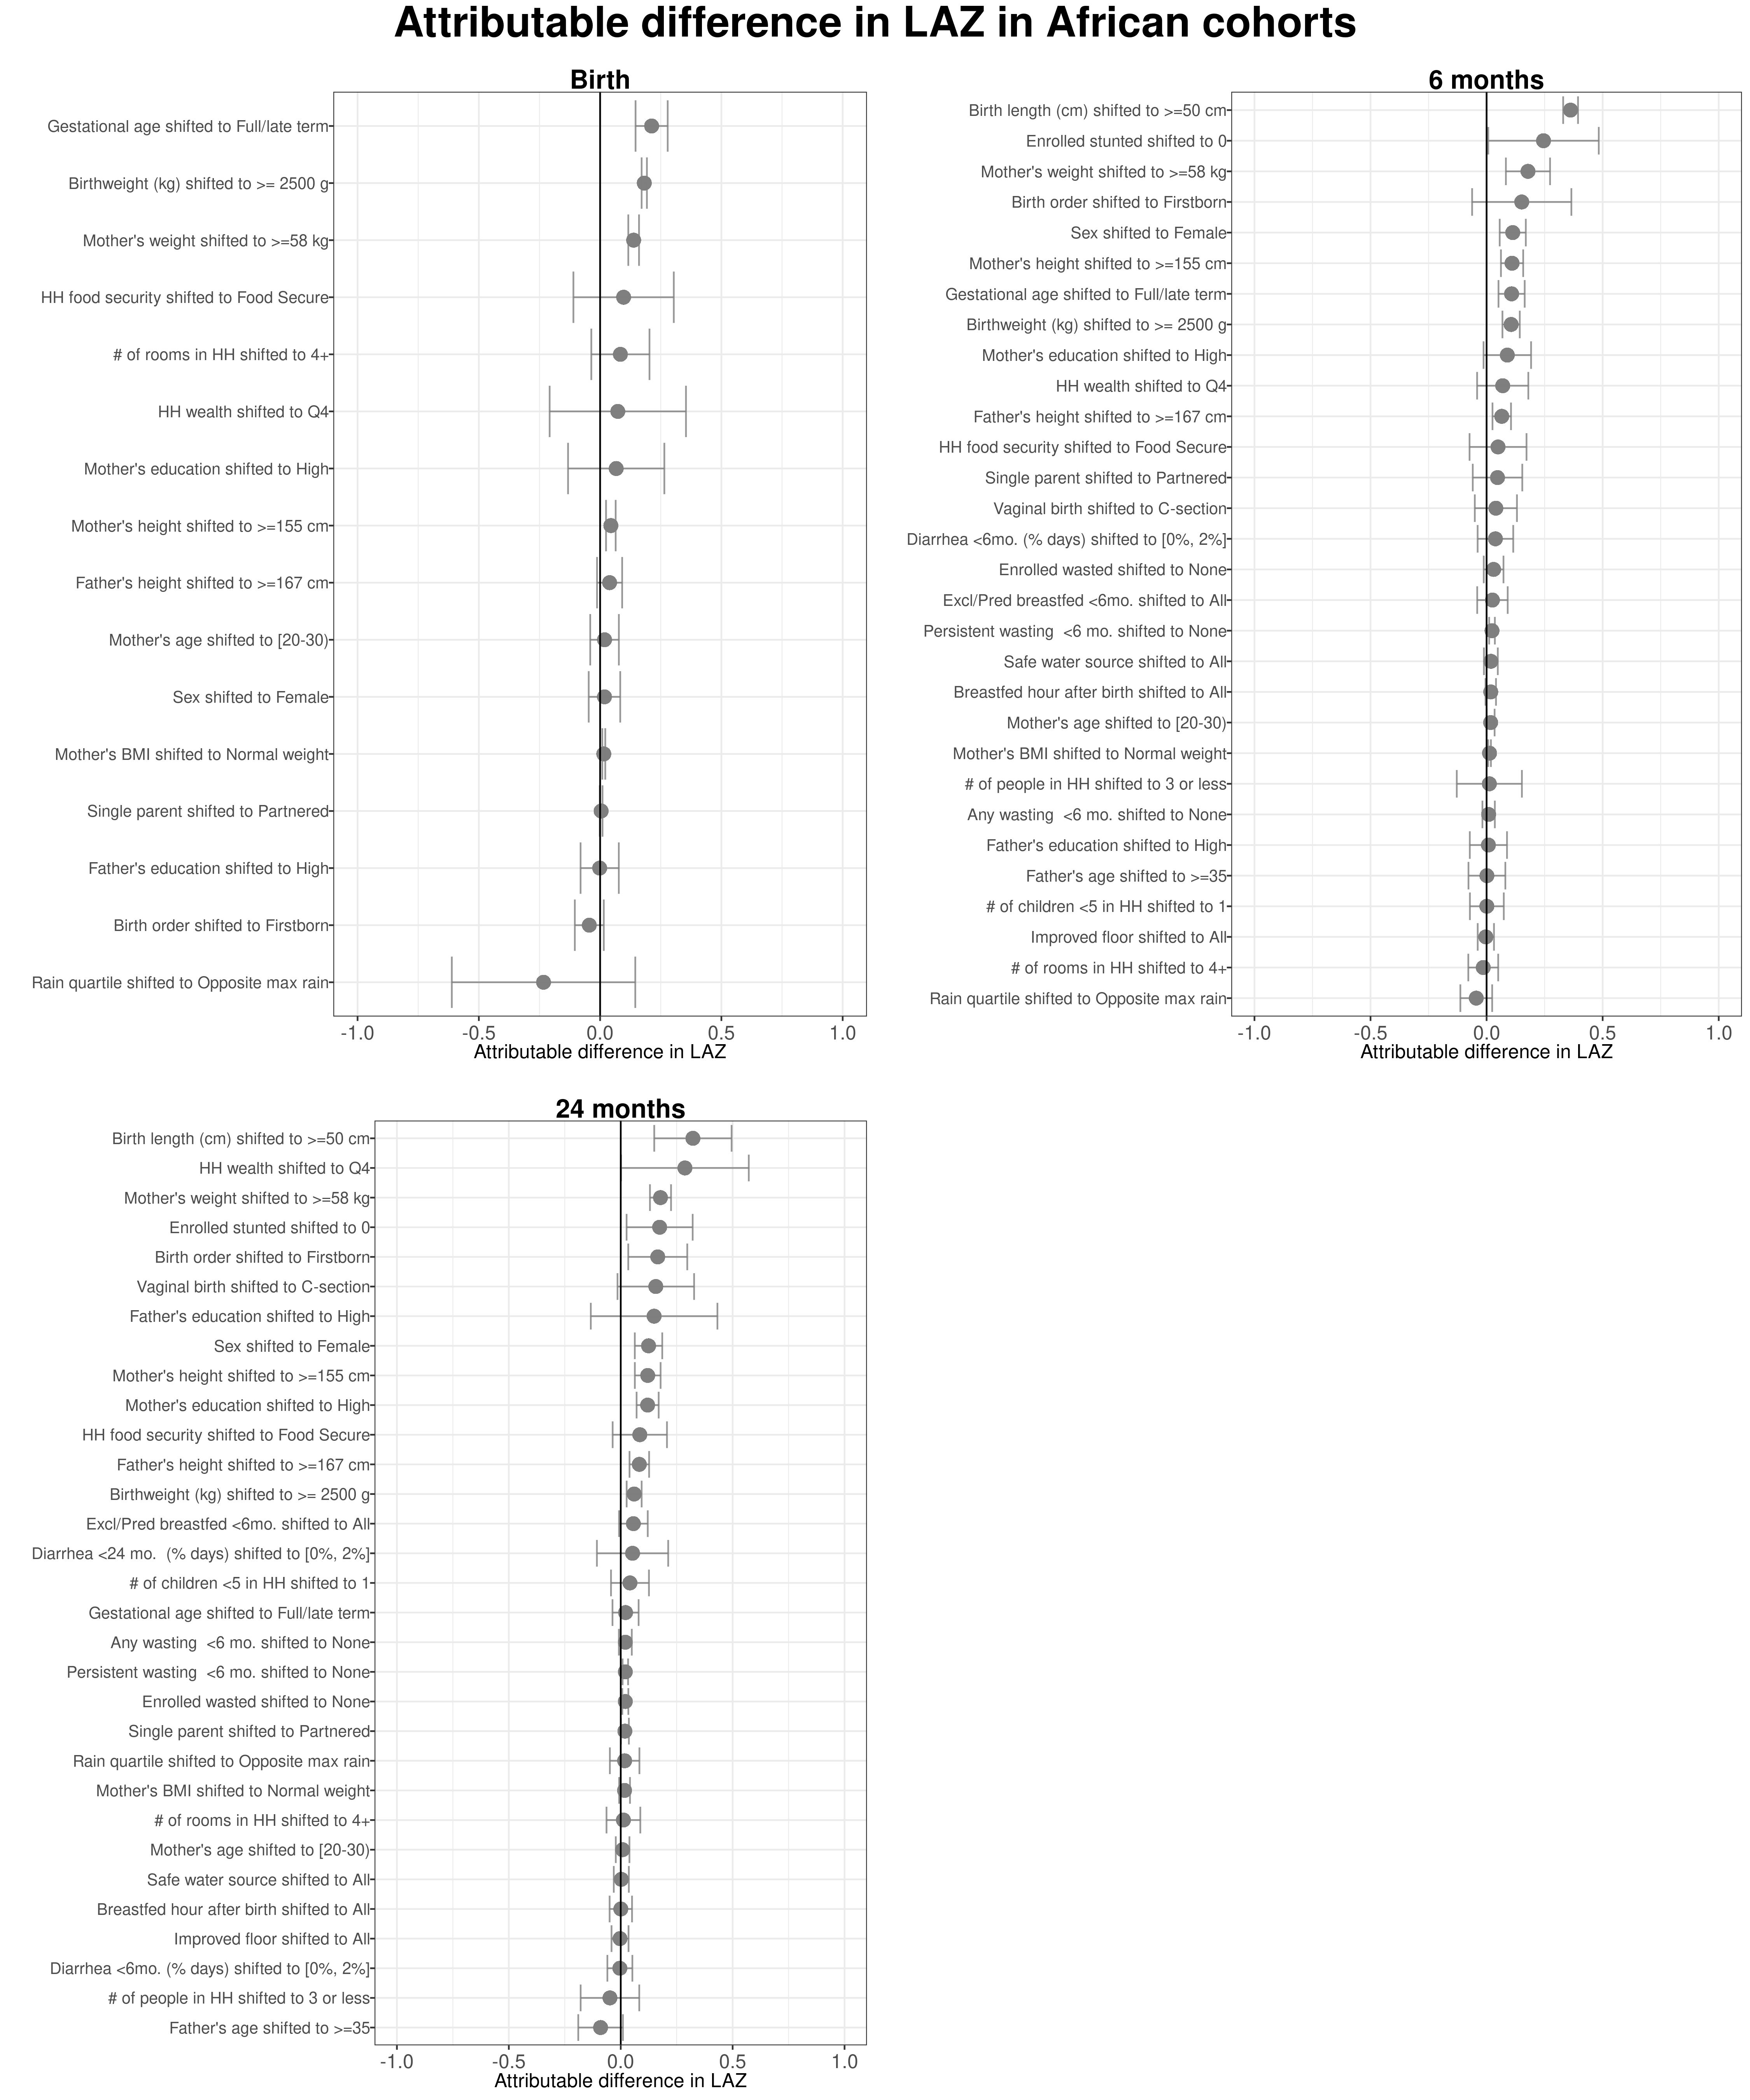
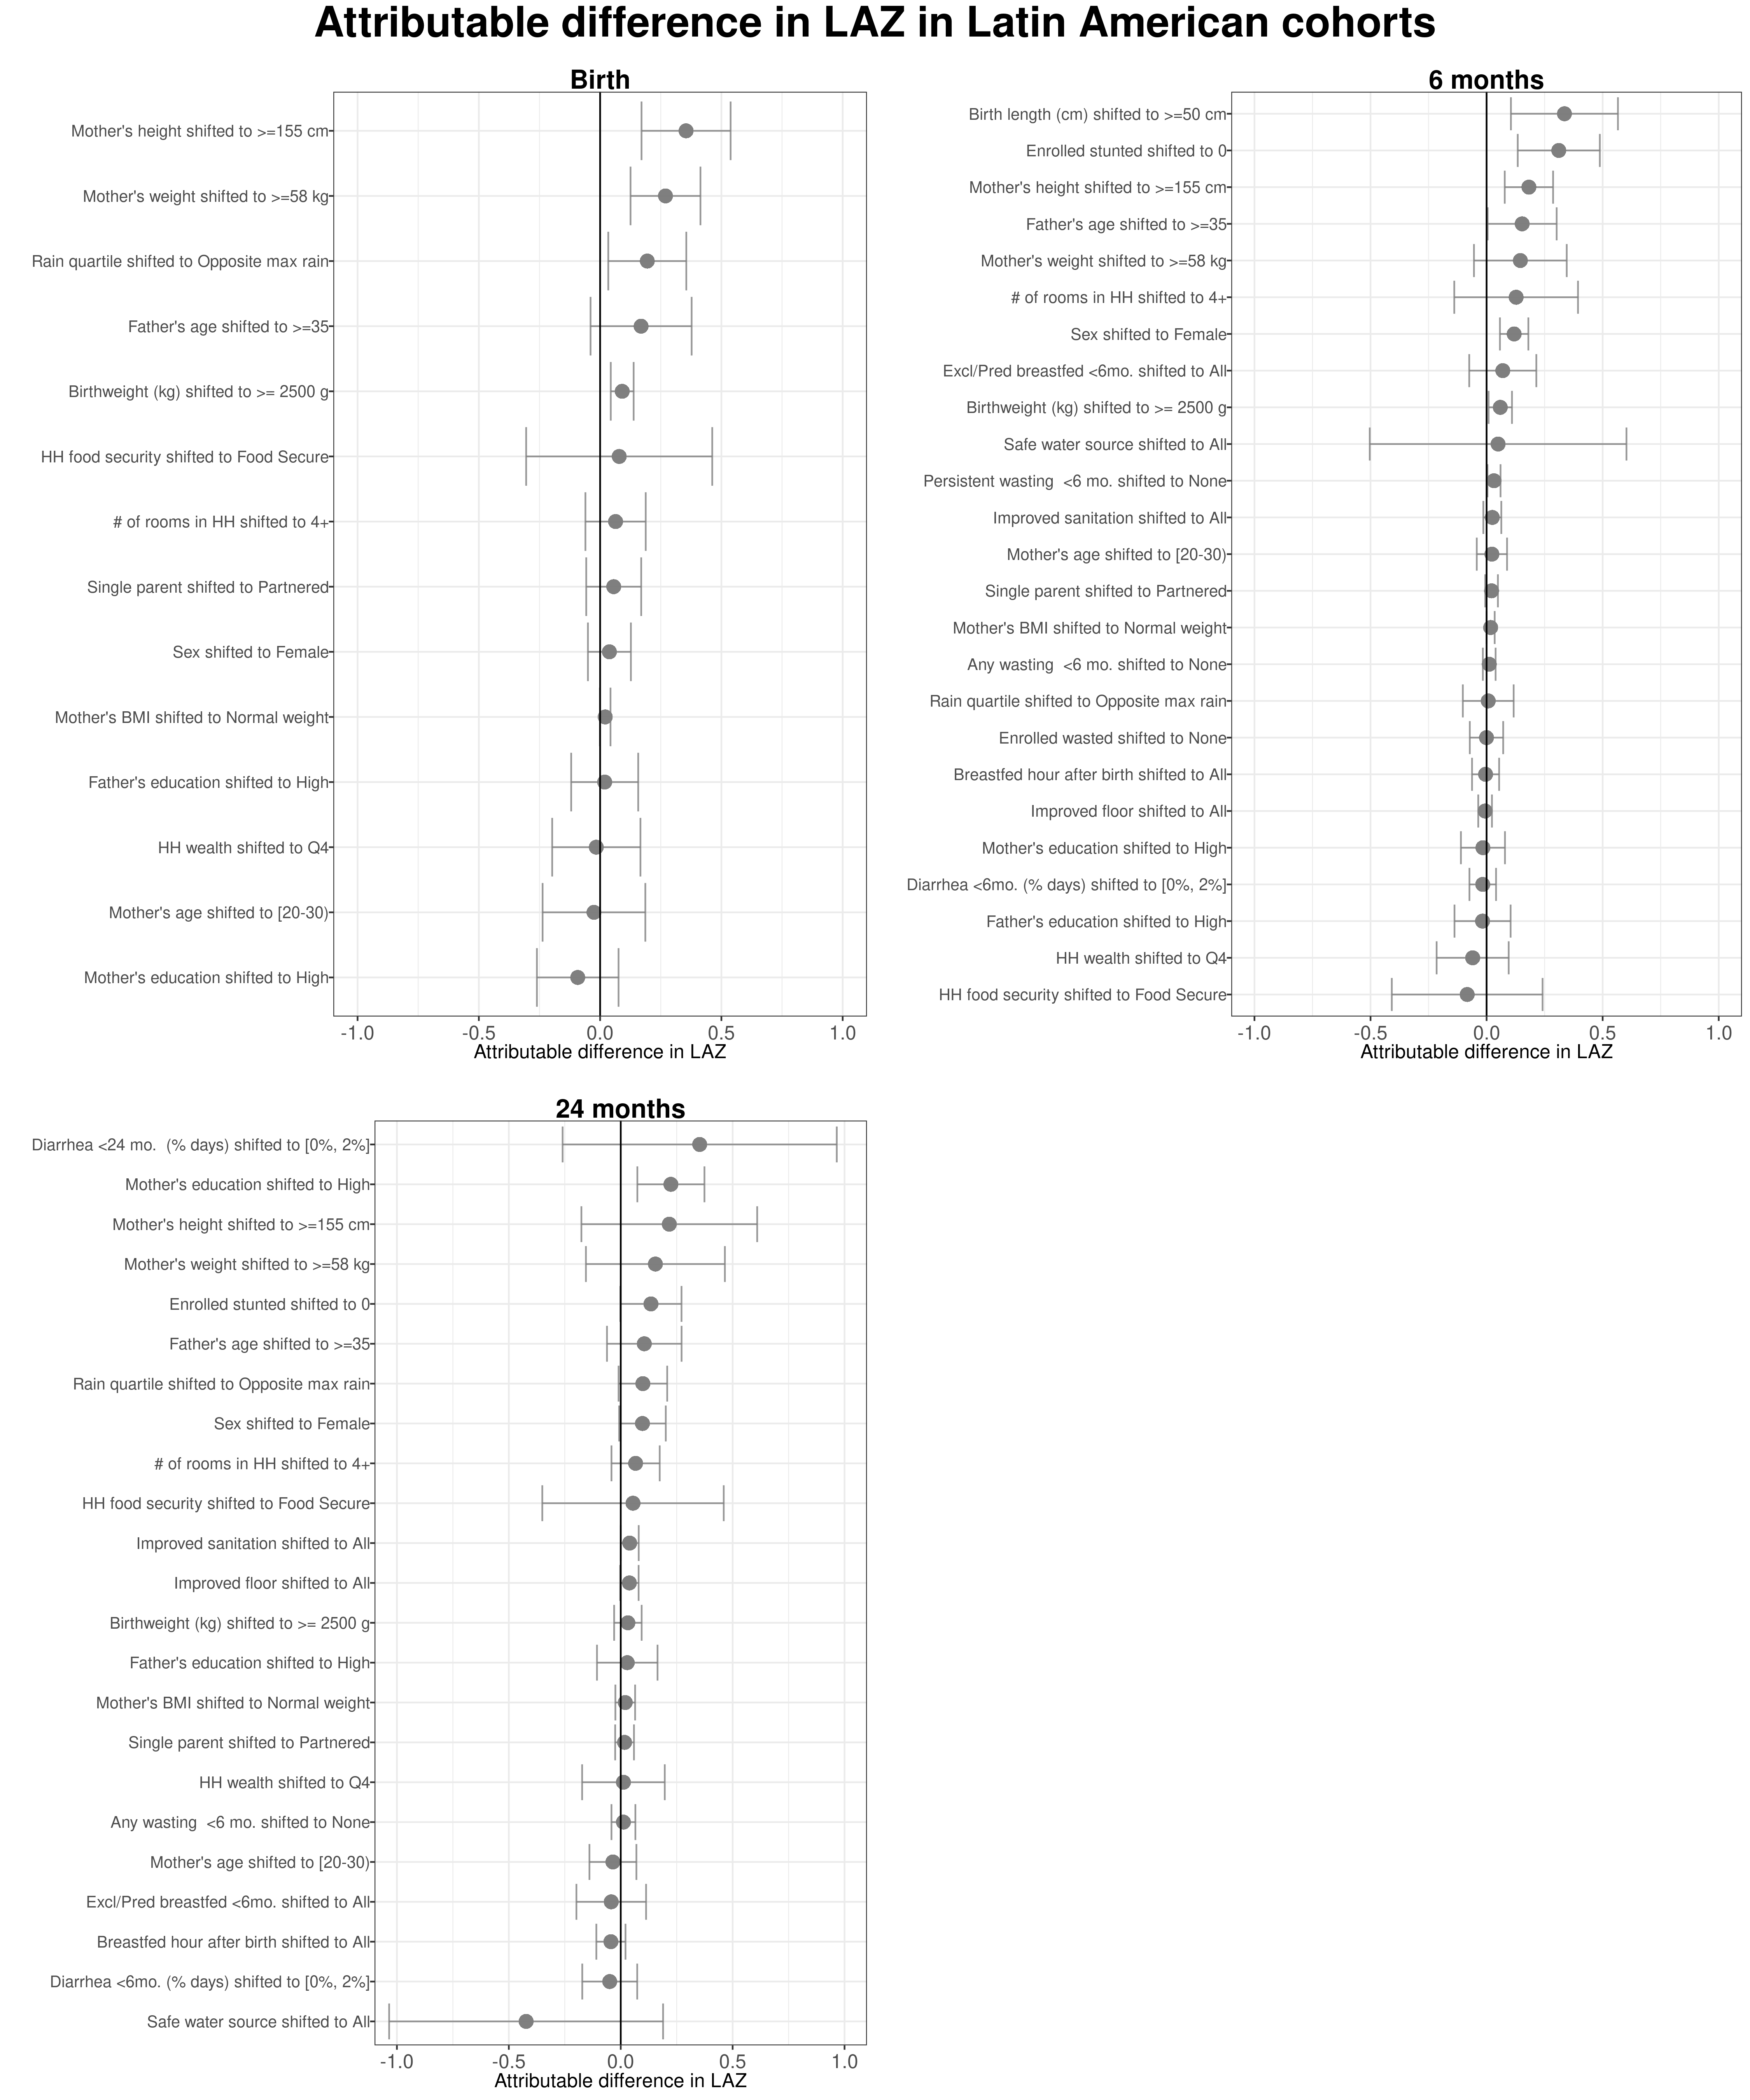
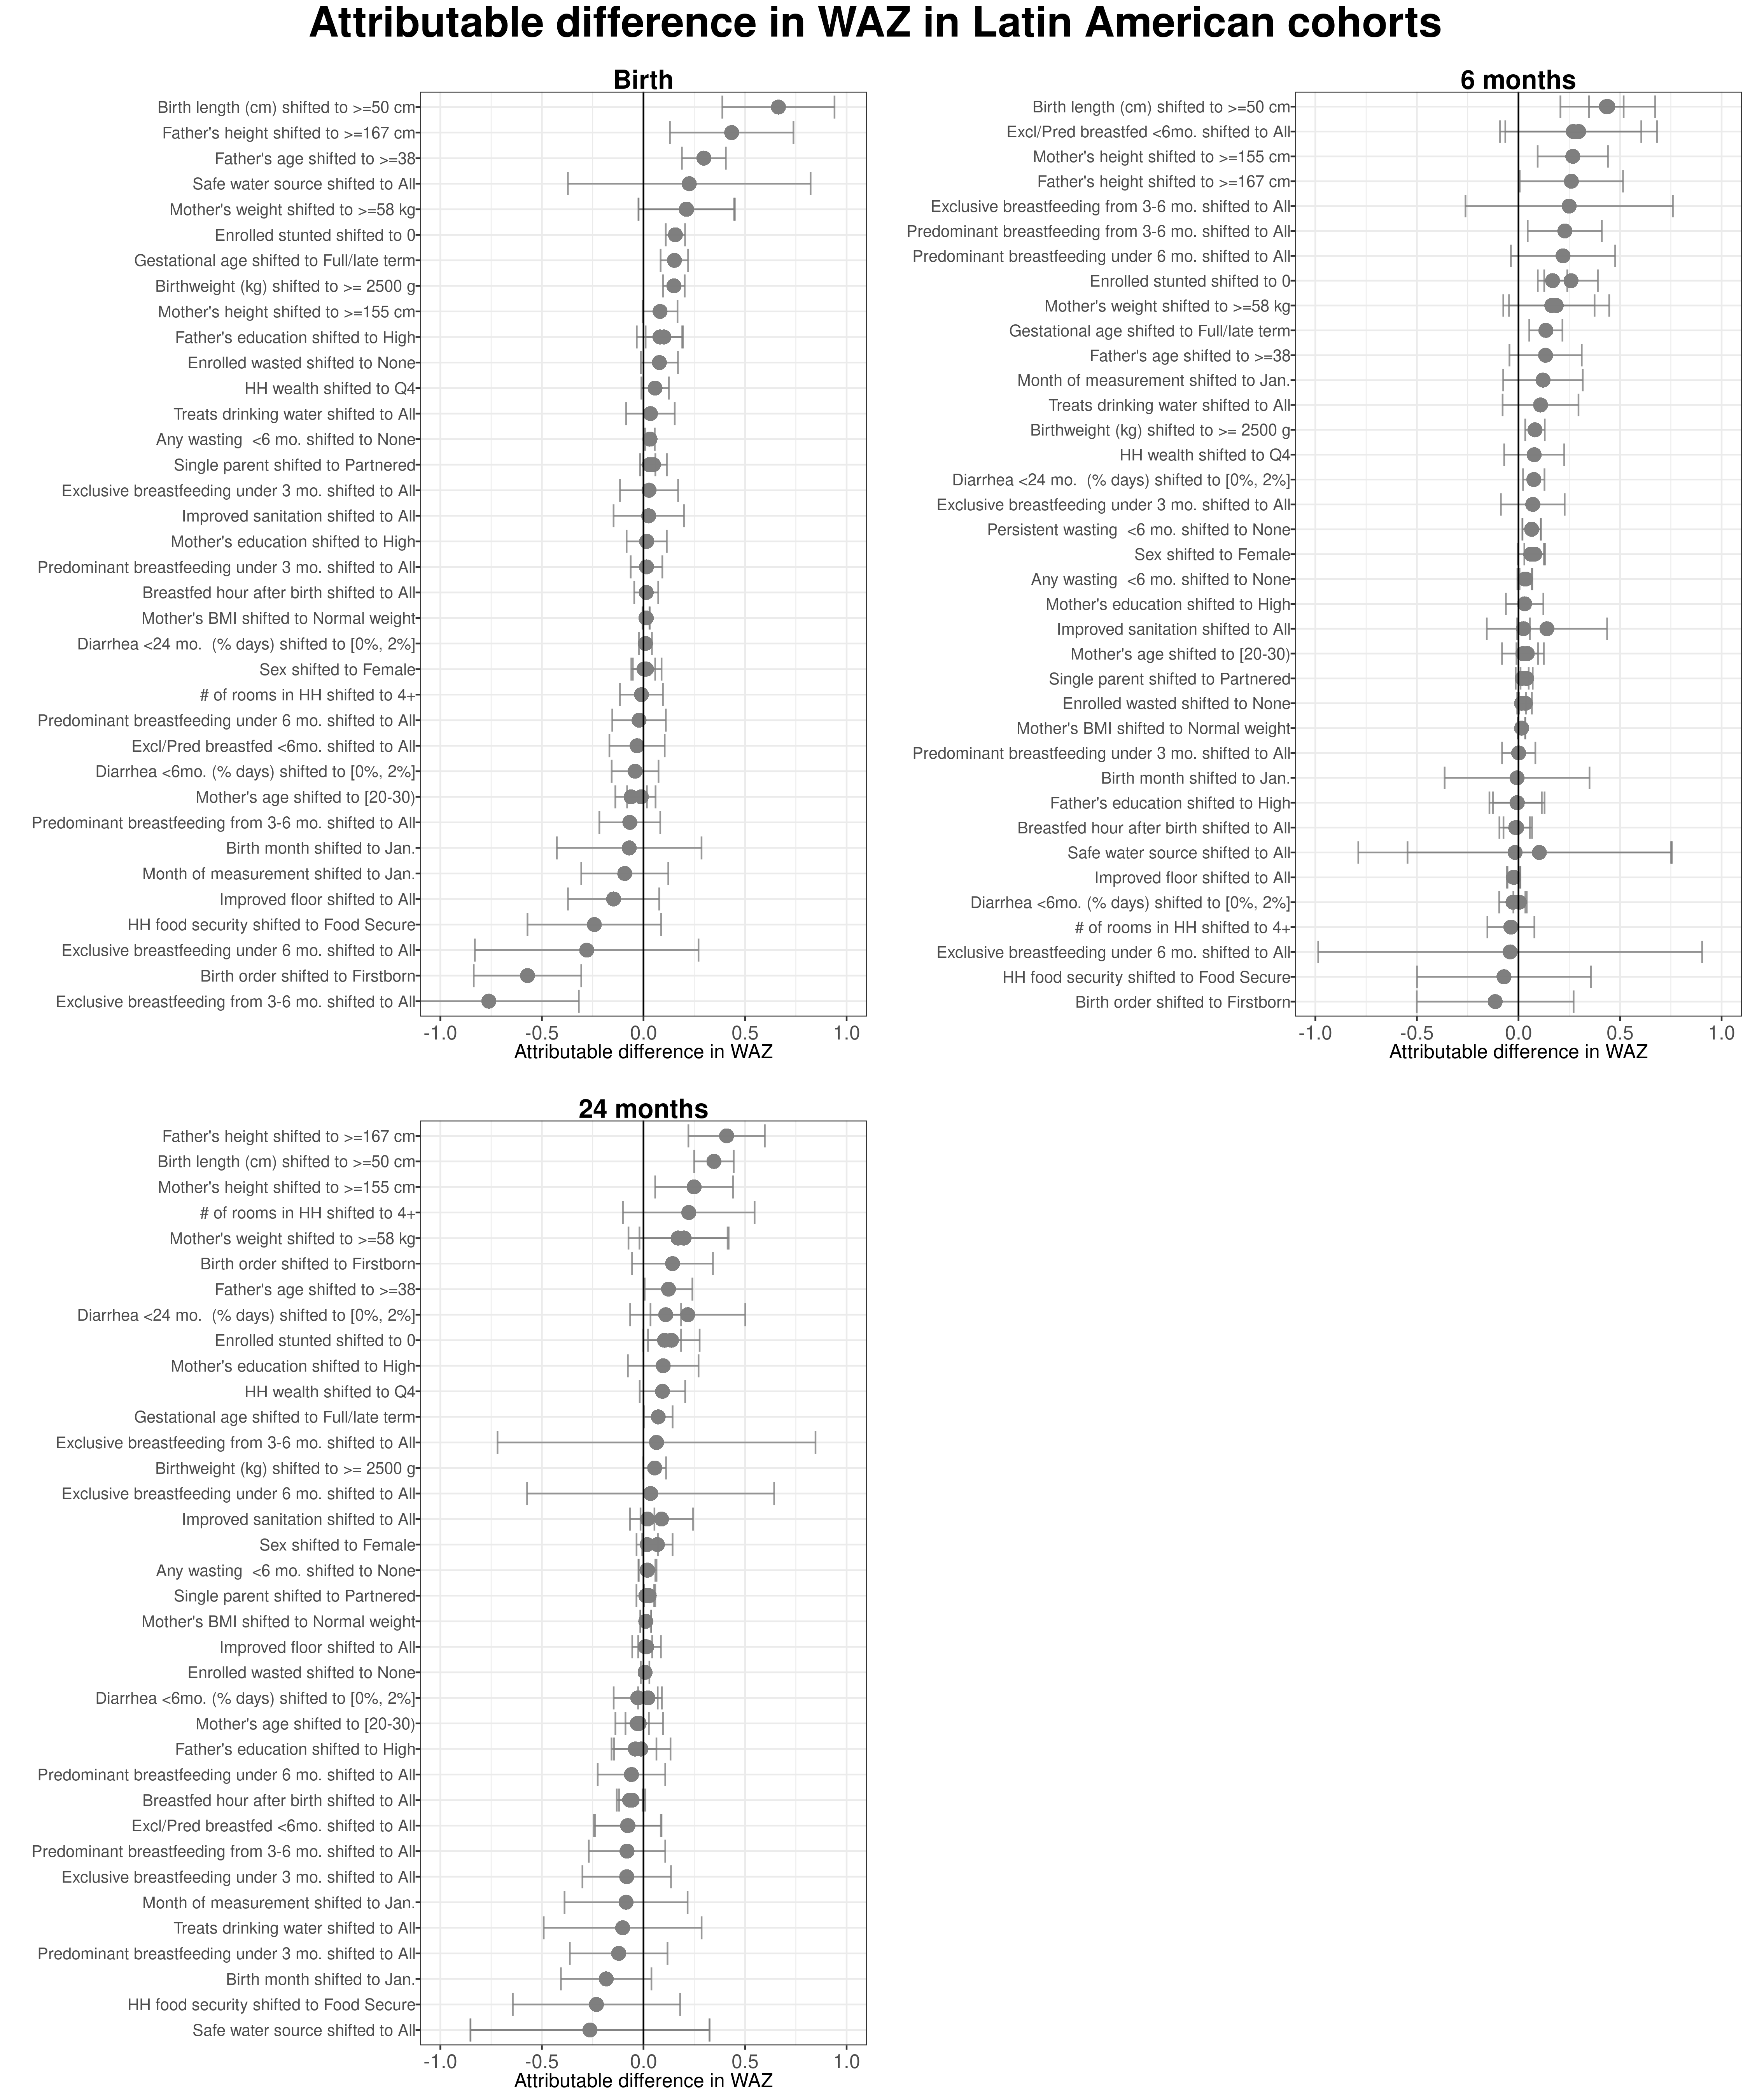
9.2 Region and age-stratified population attributable differences in length-for-age Z-scores
South Asia
Africa
Latin America
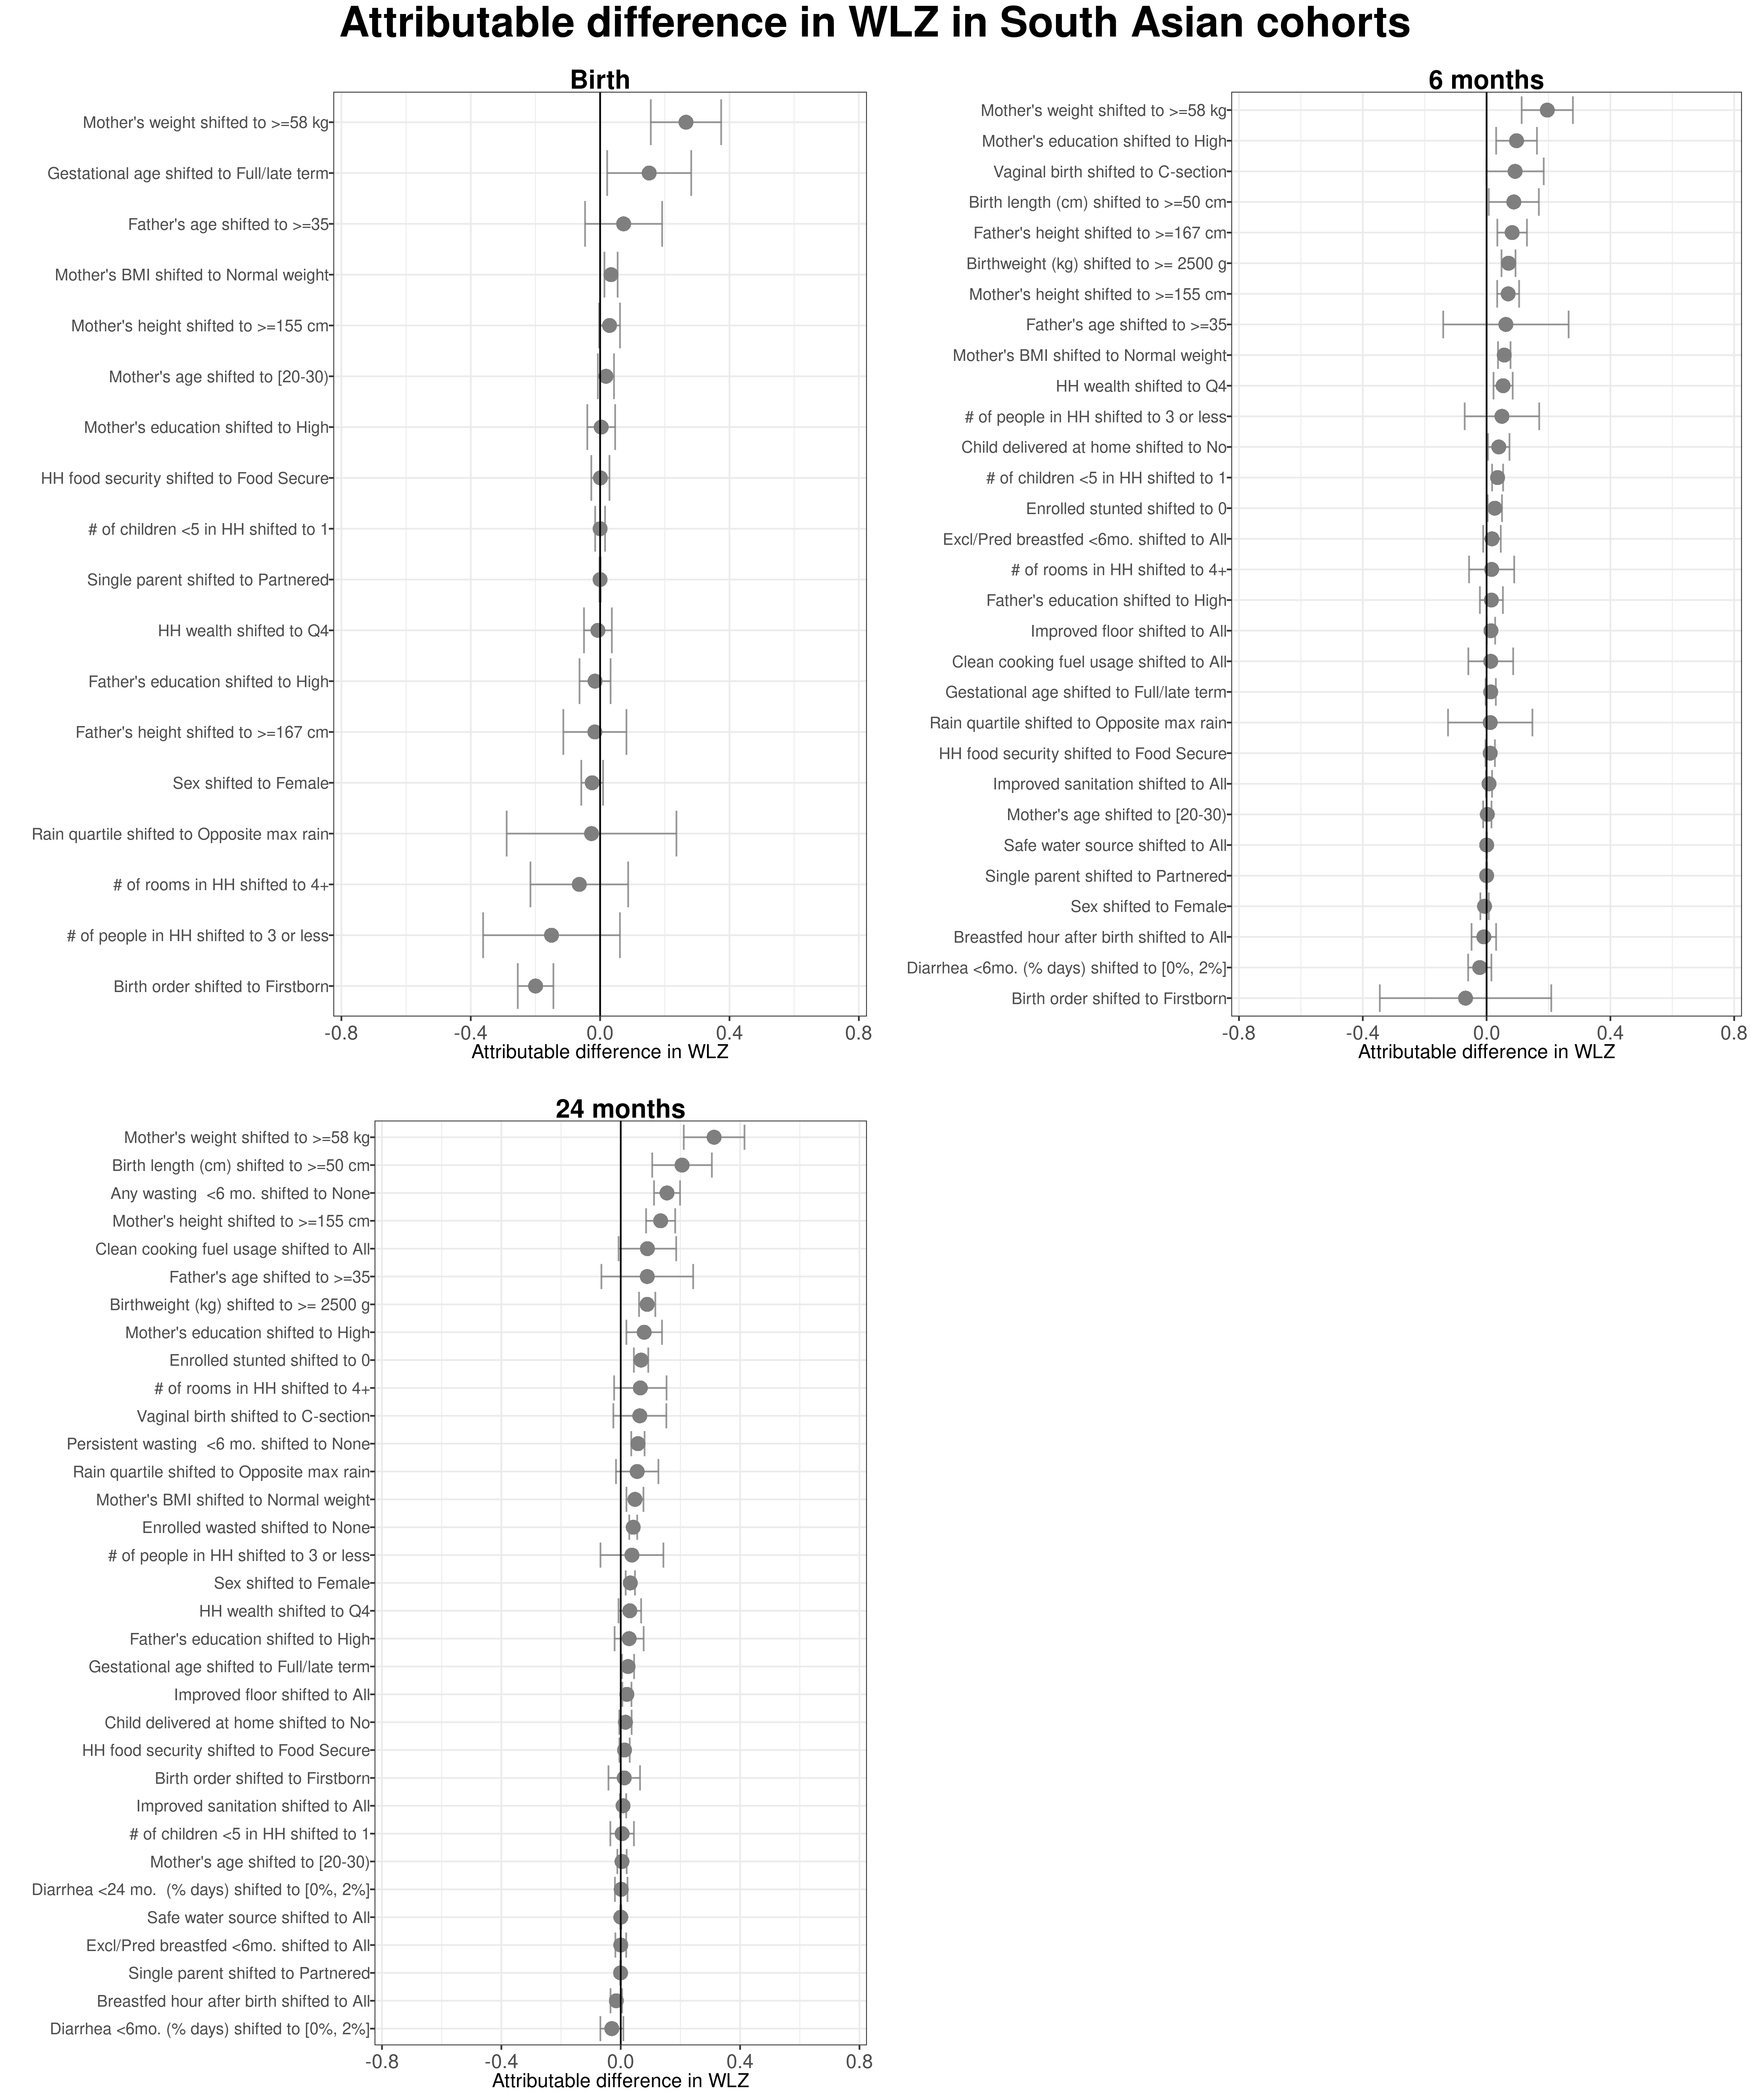
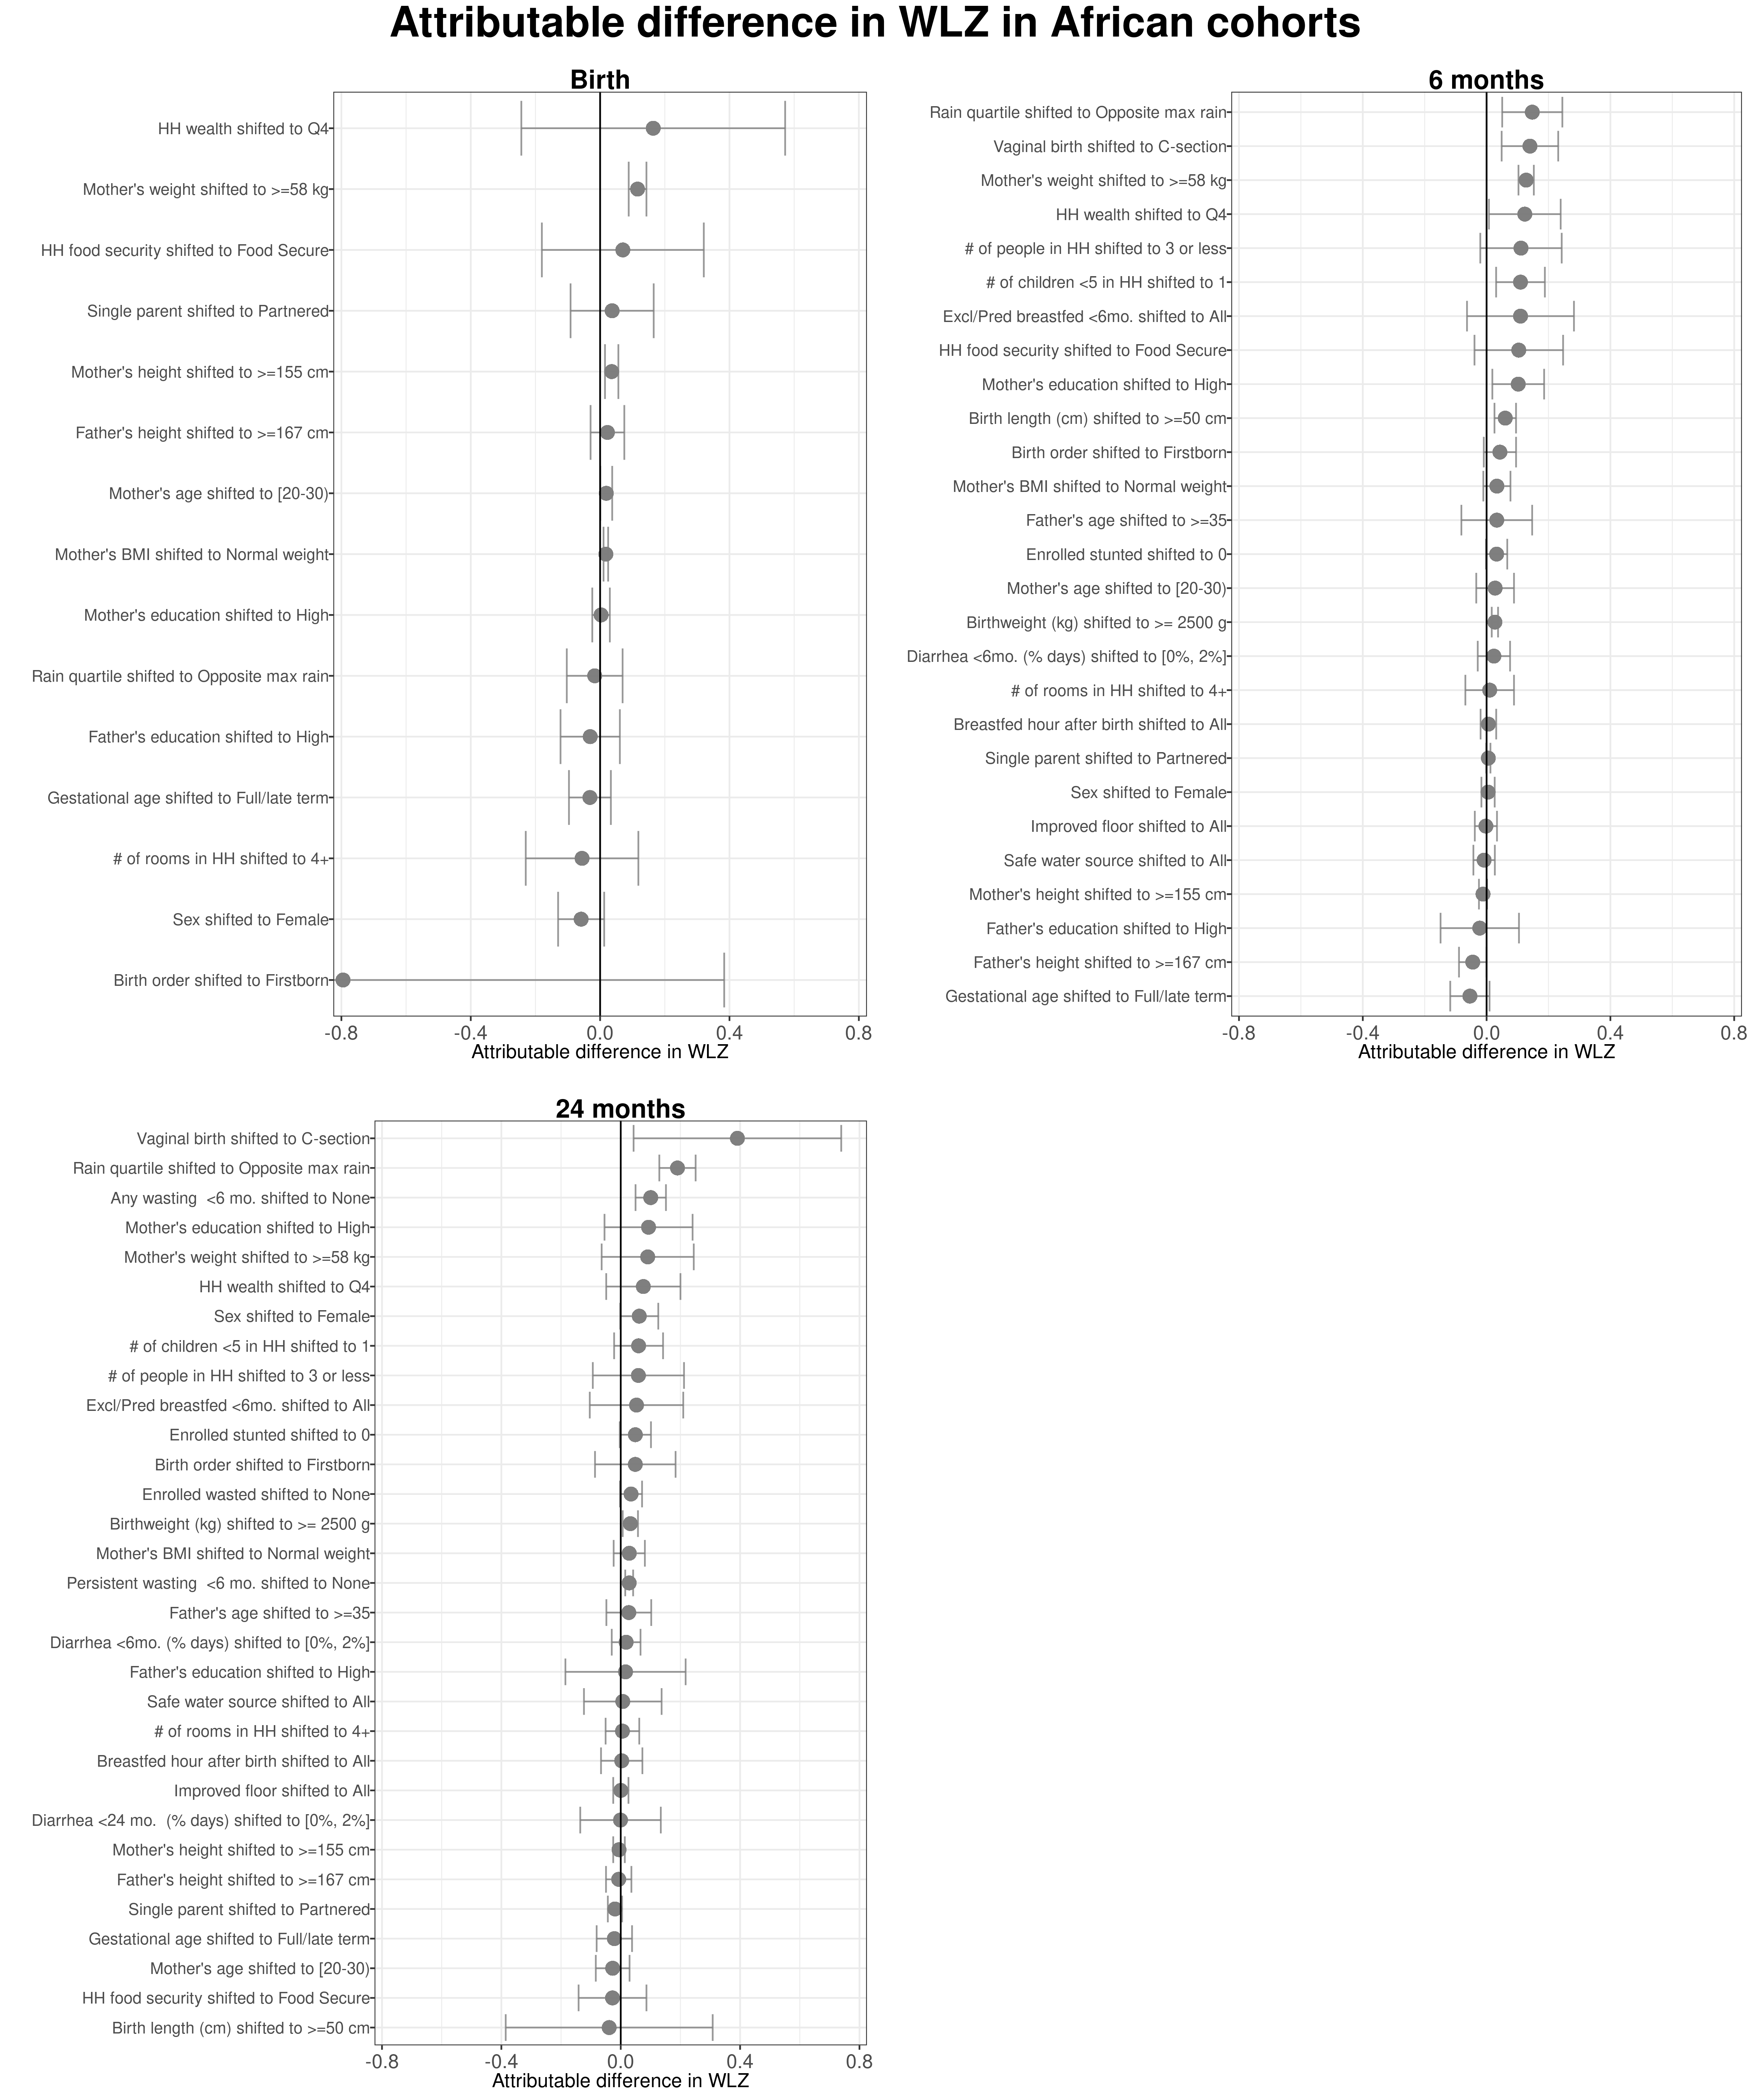
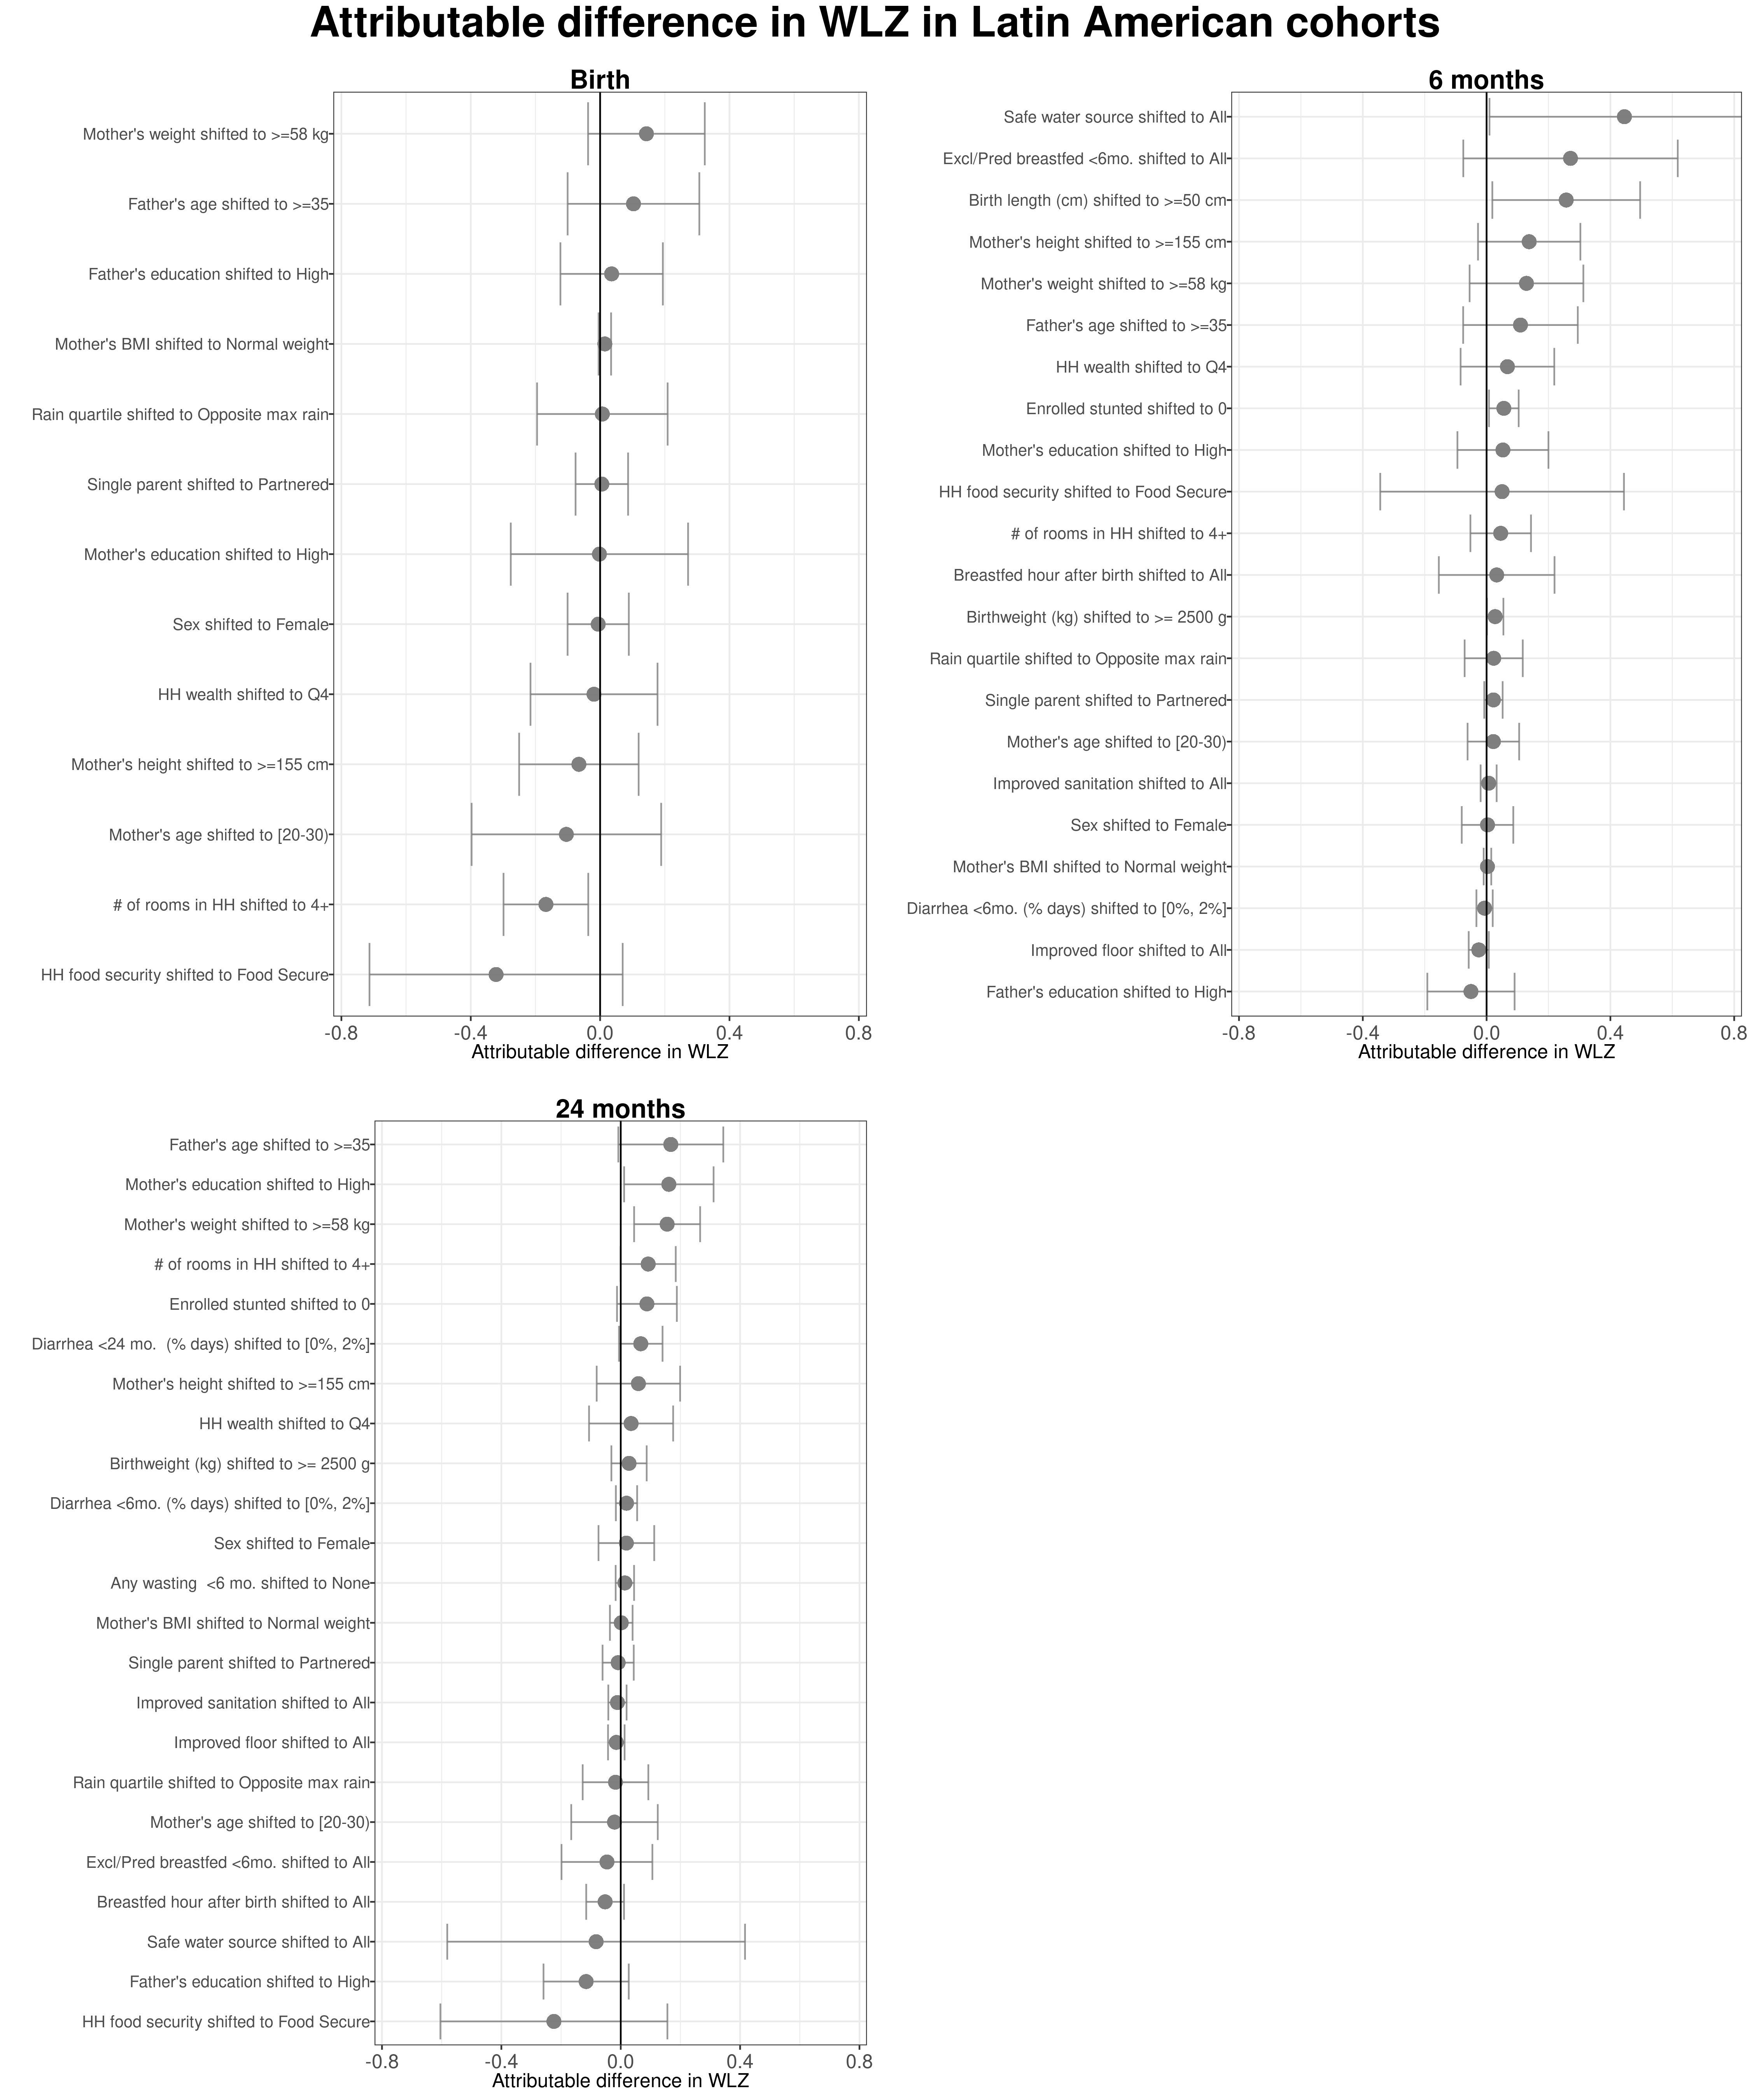
9.3 Region and age-stratified population attributable differences in weight-for-length Z-scores
South Asia
Africa
Latin America
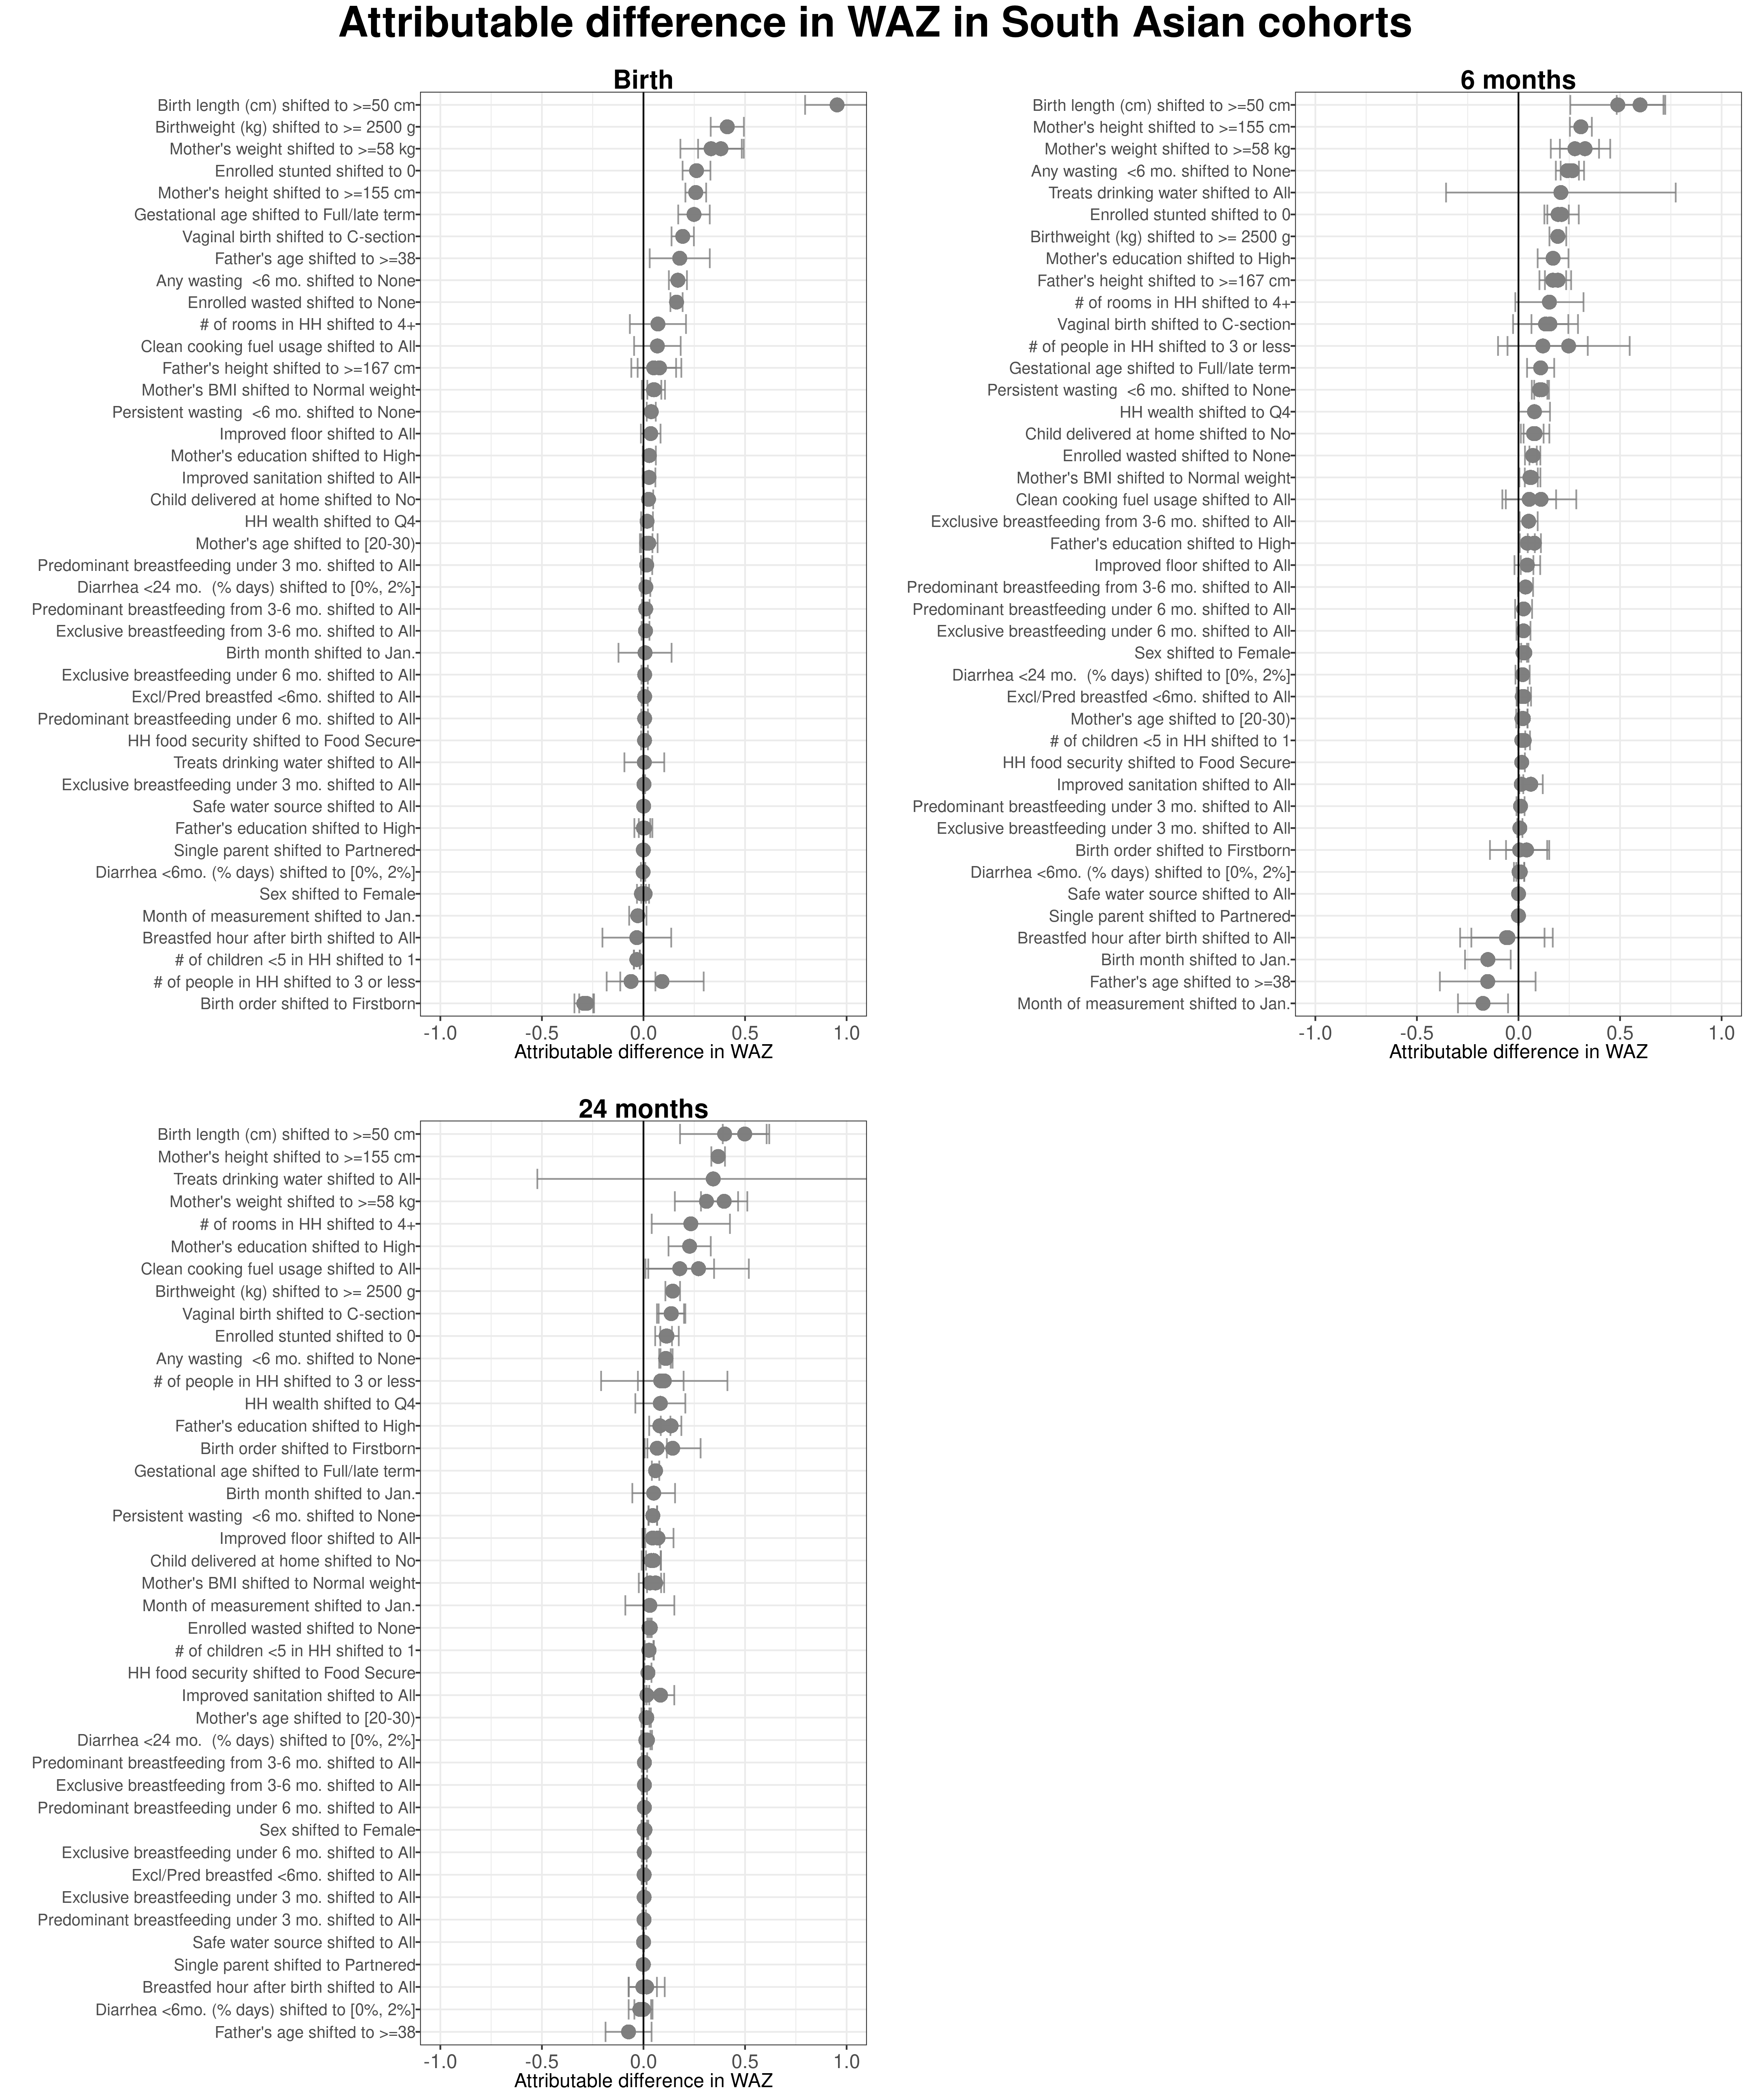
9.4 Region and age-stratified population attributable differences in weight-for-age Z-scores
South Asia
Africa
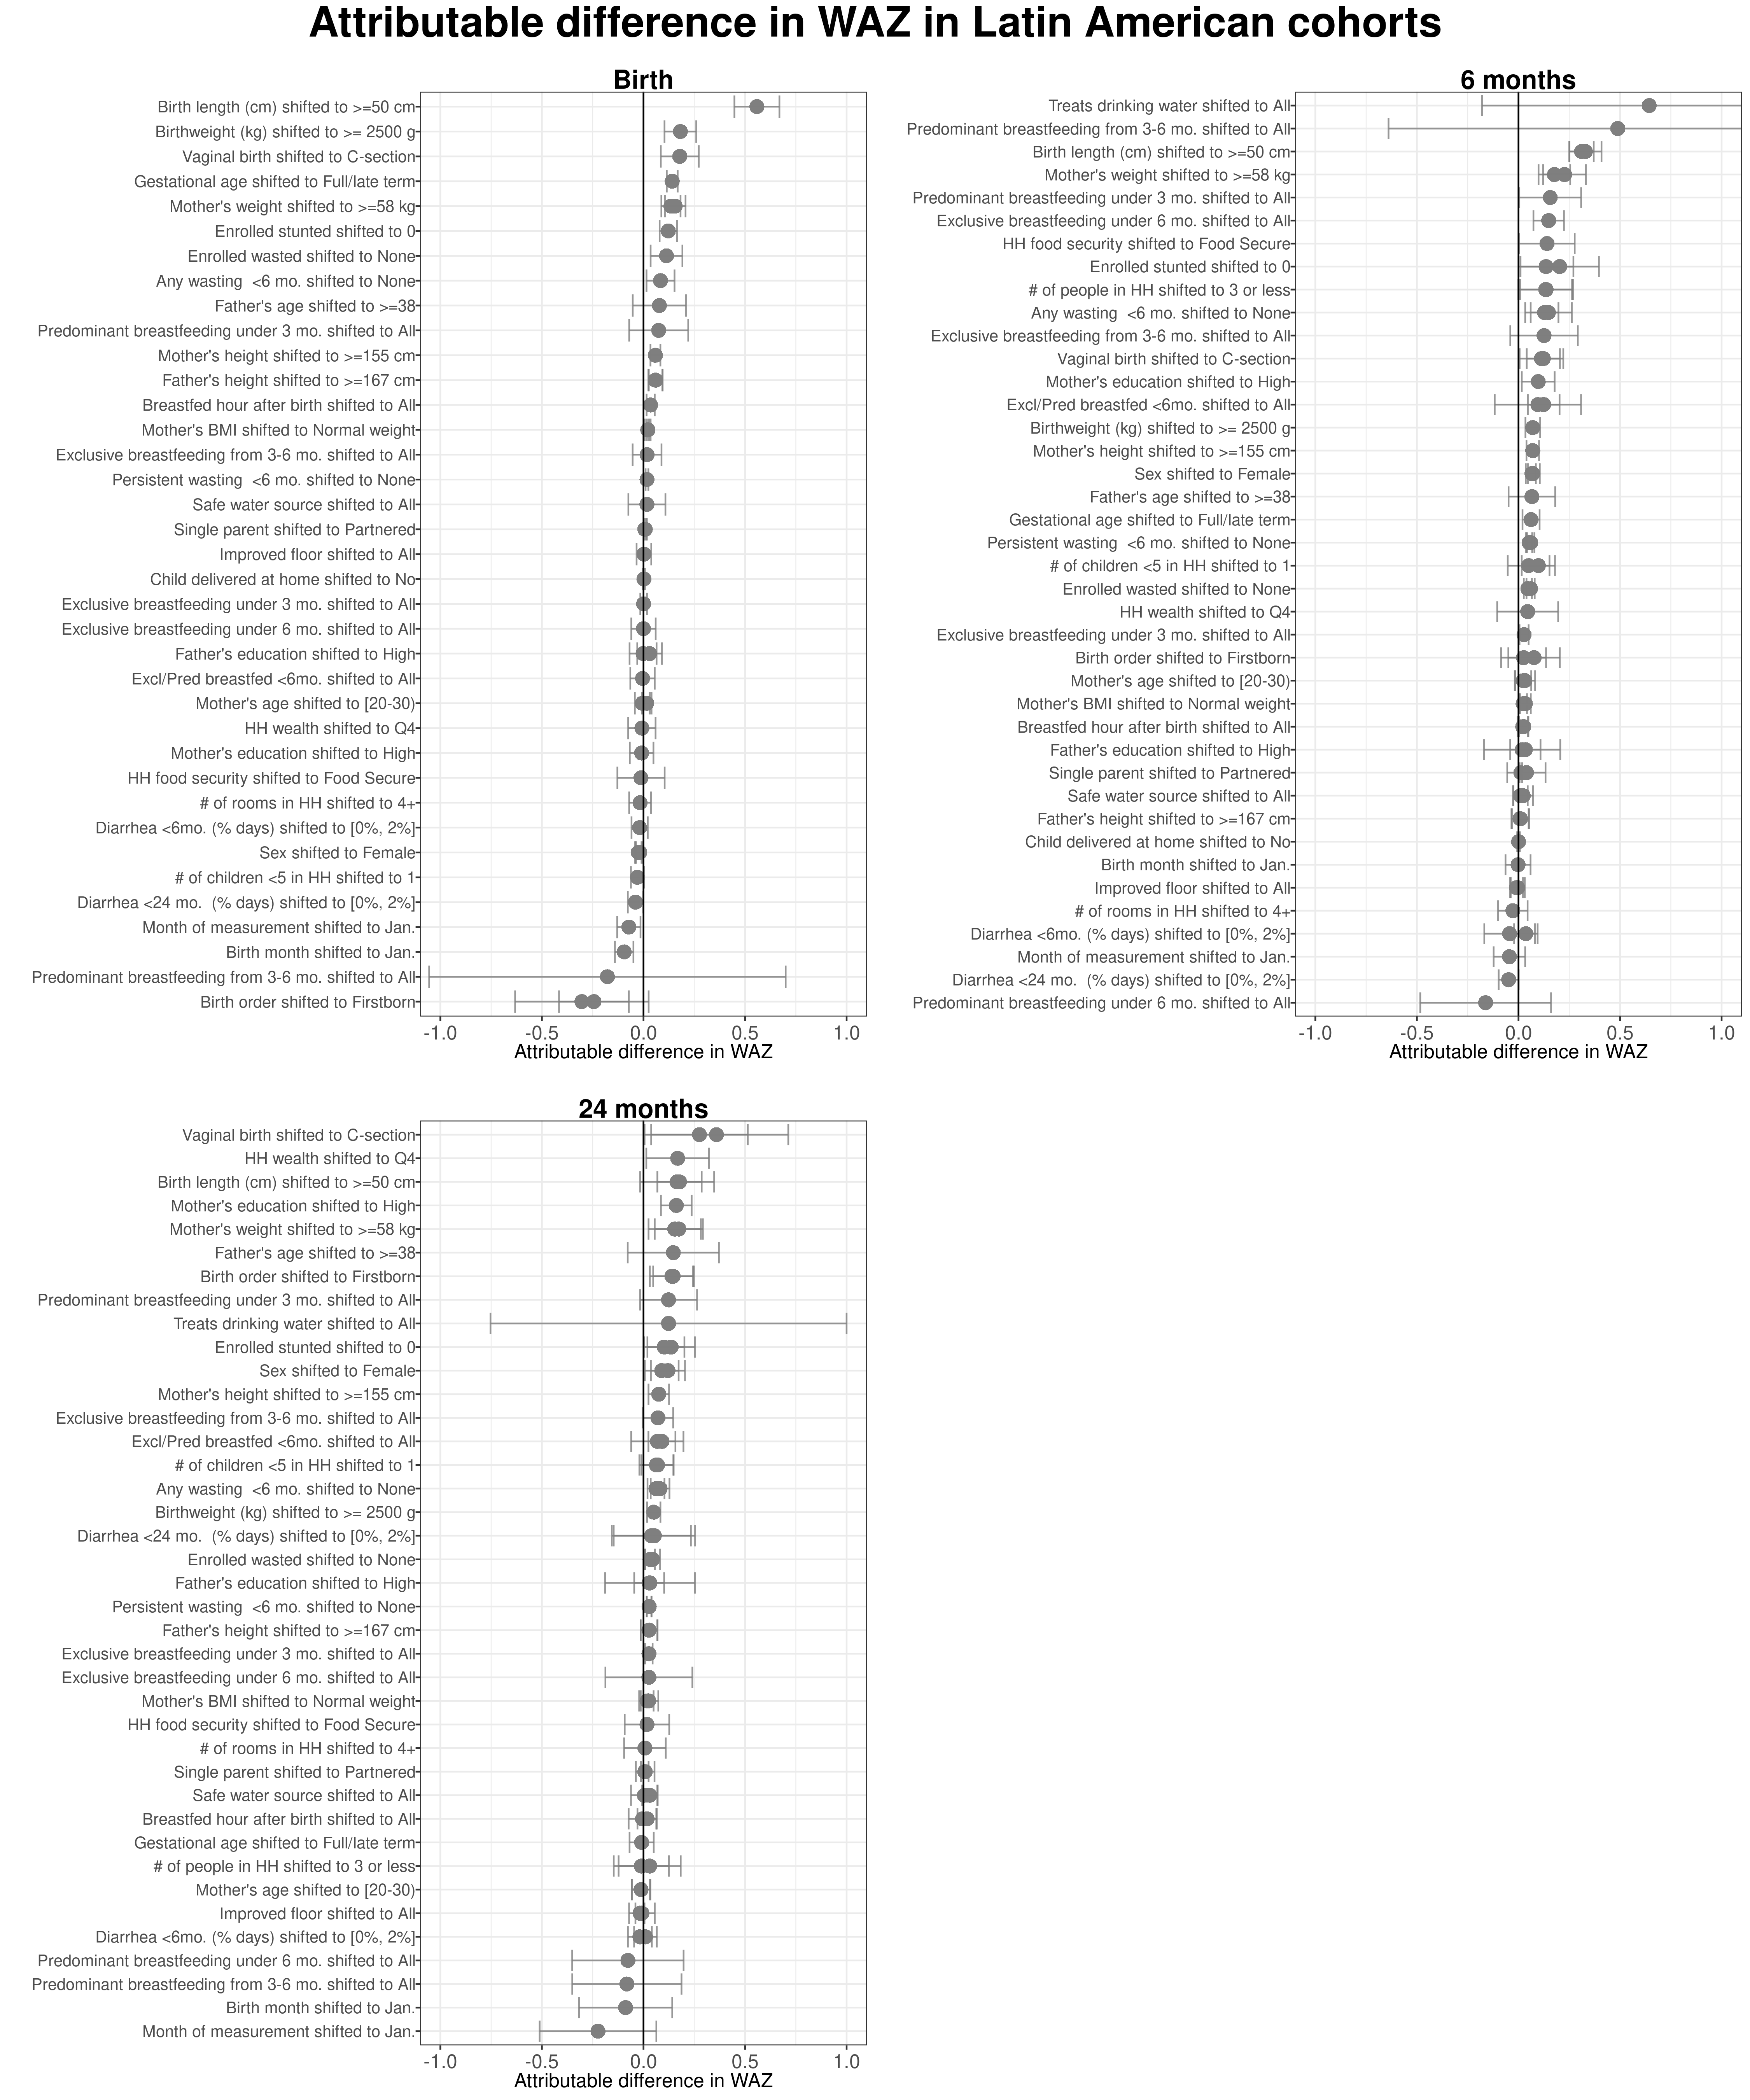
Latin America
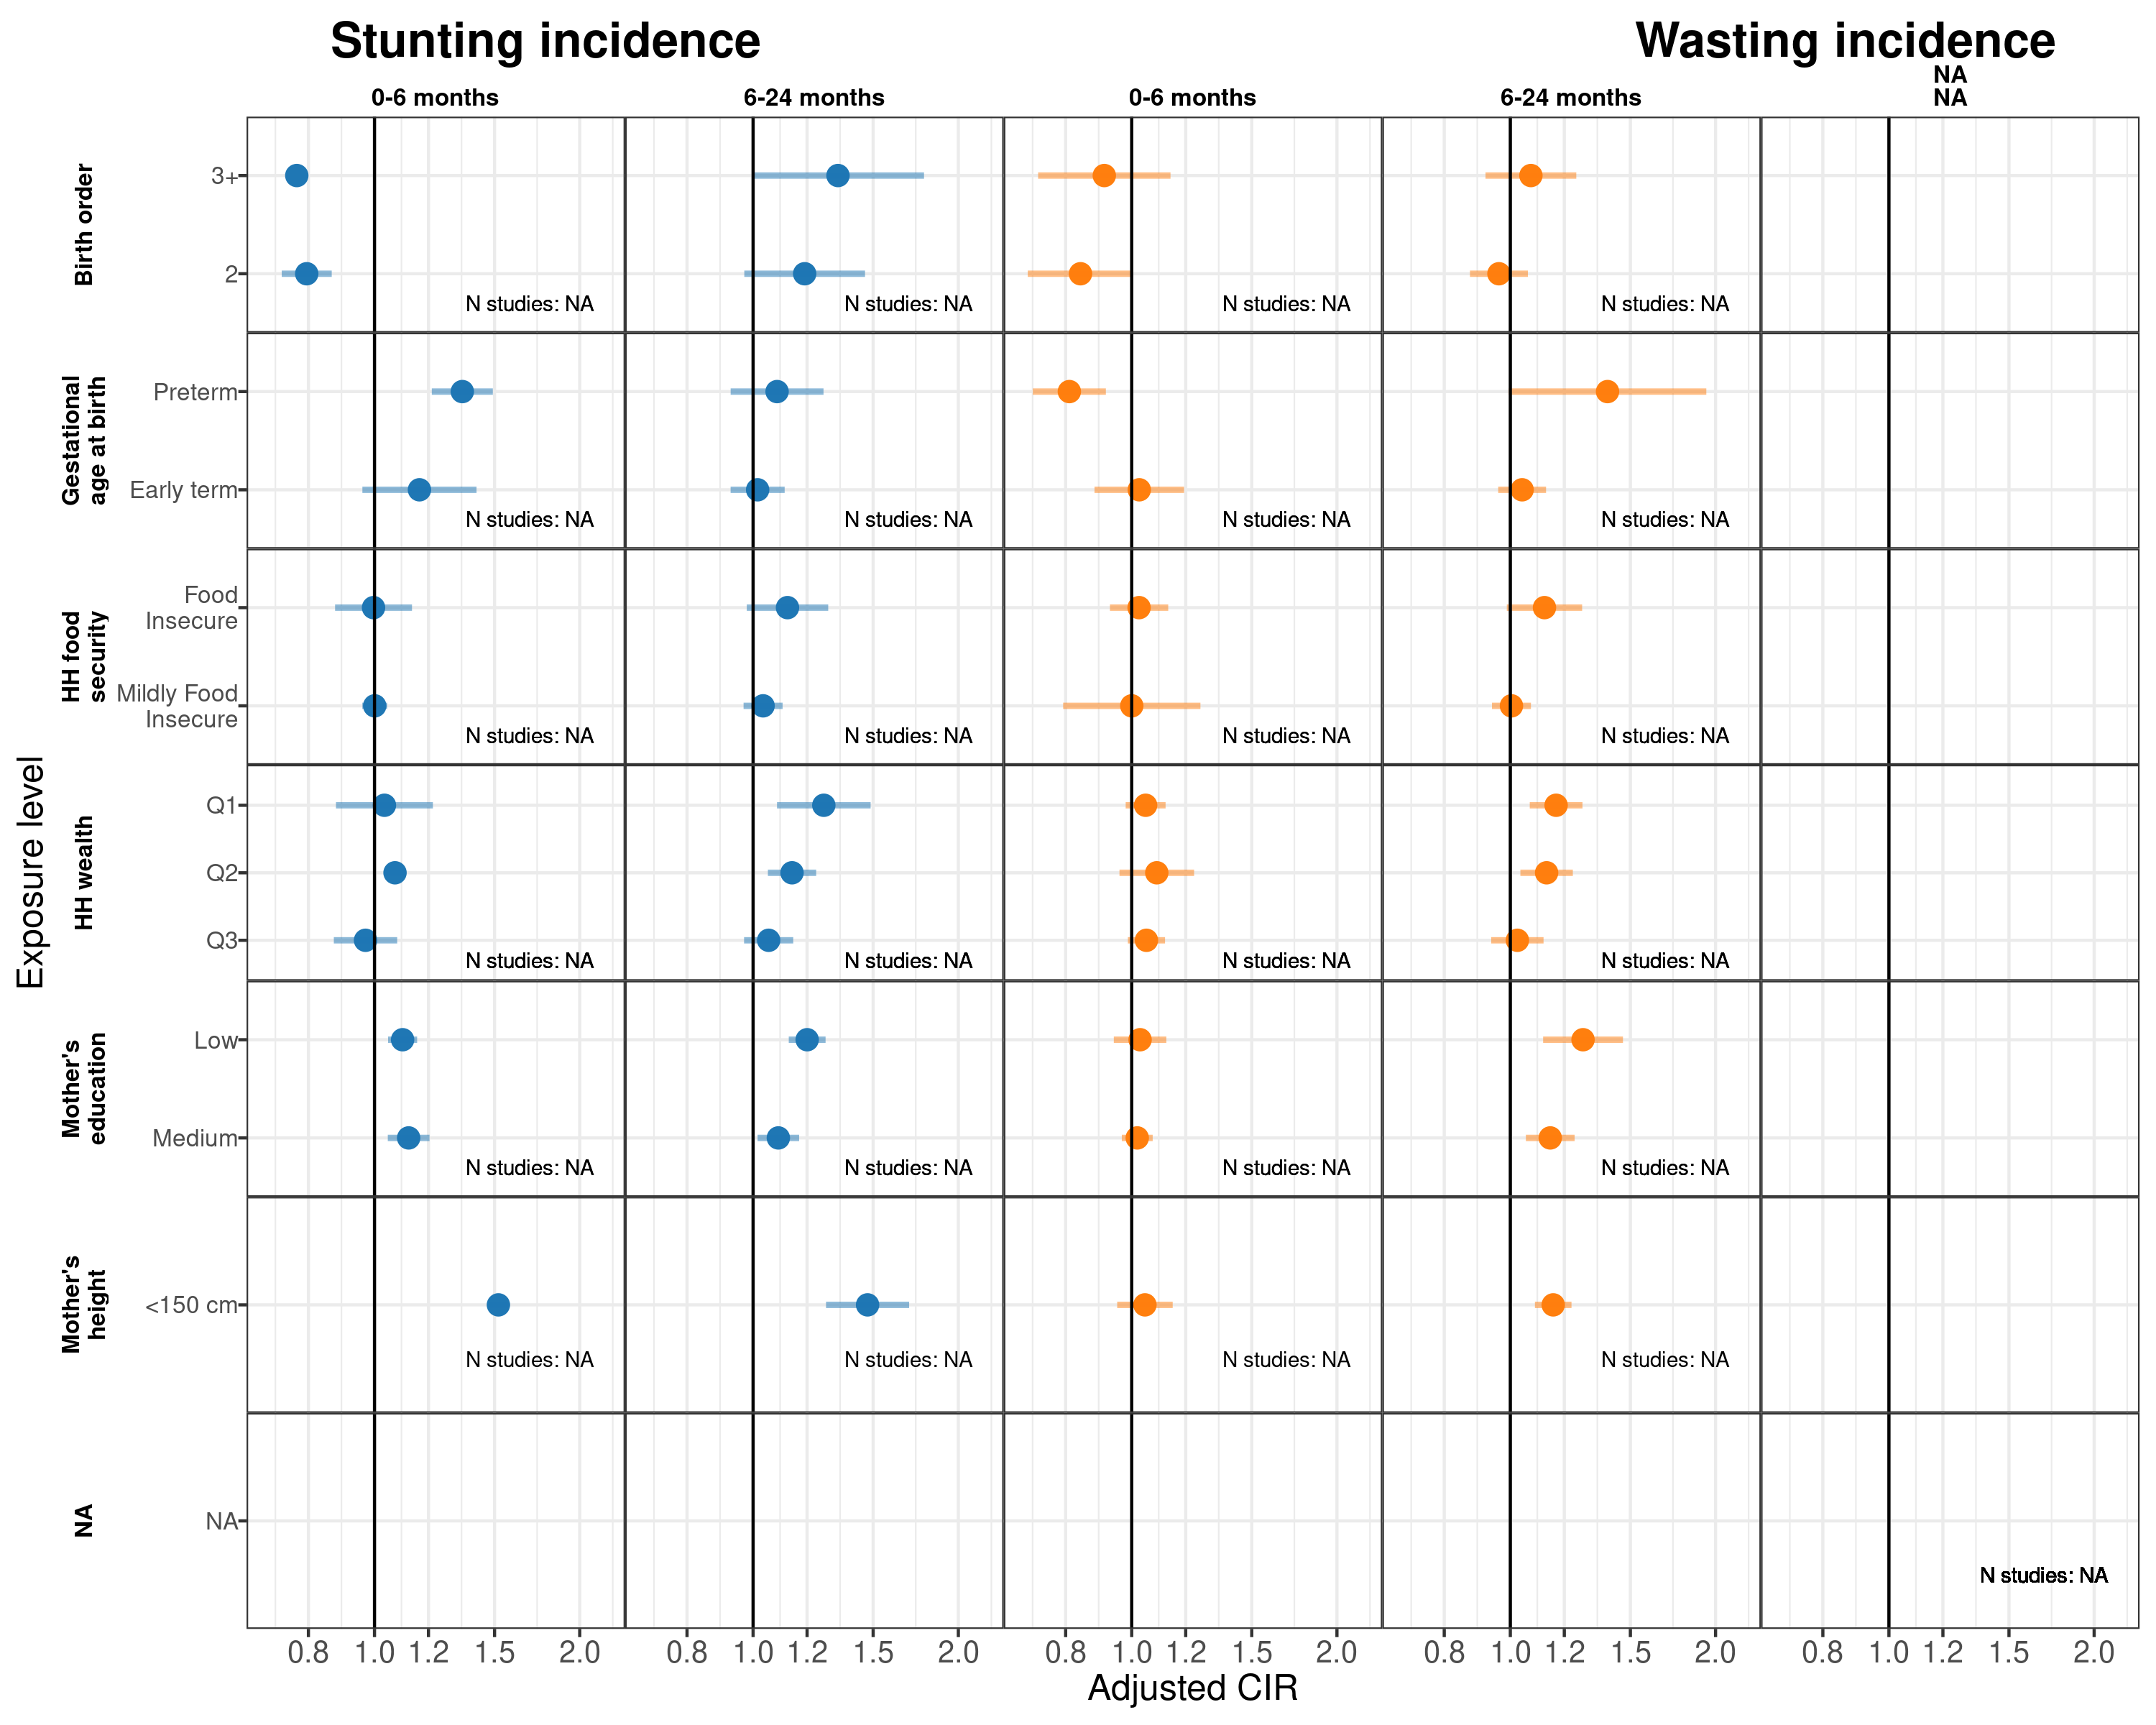
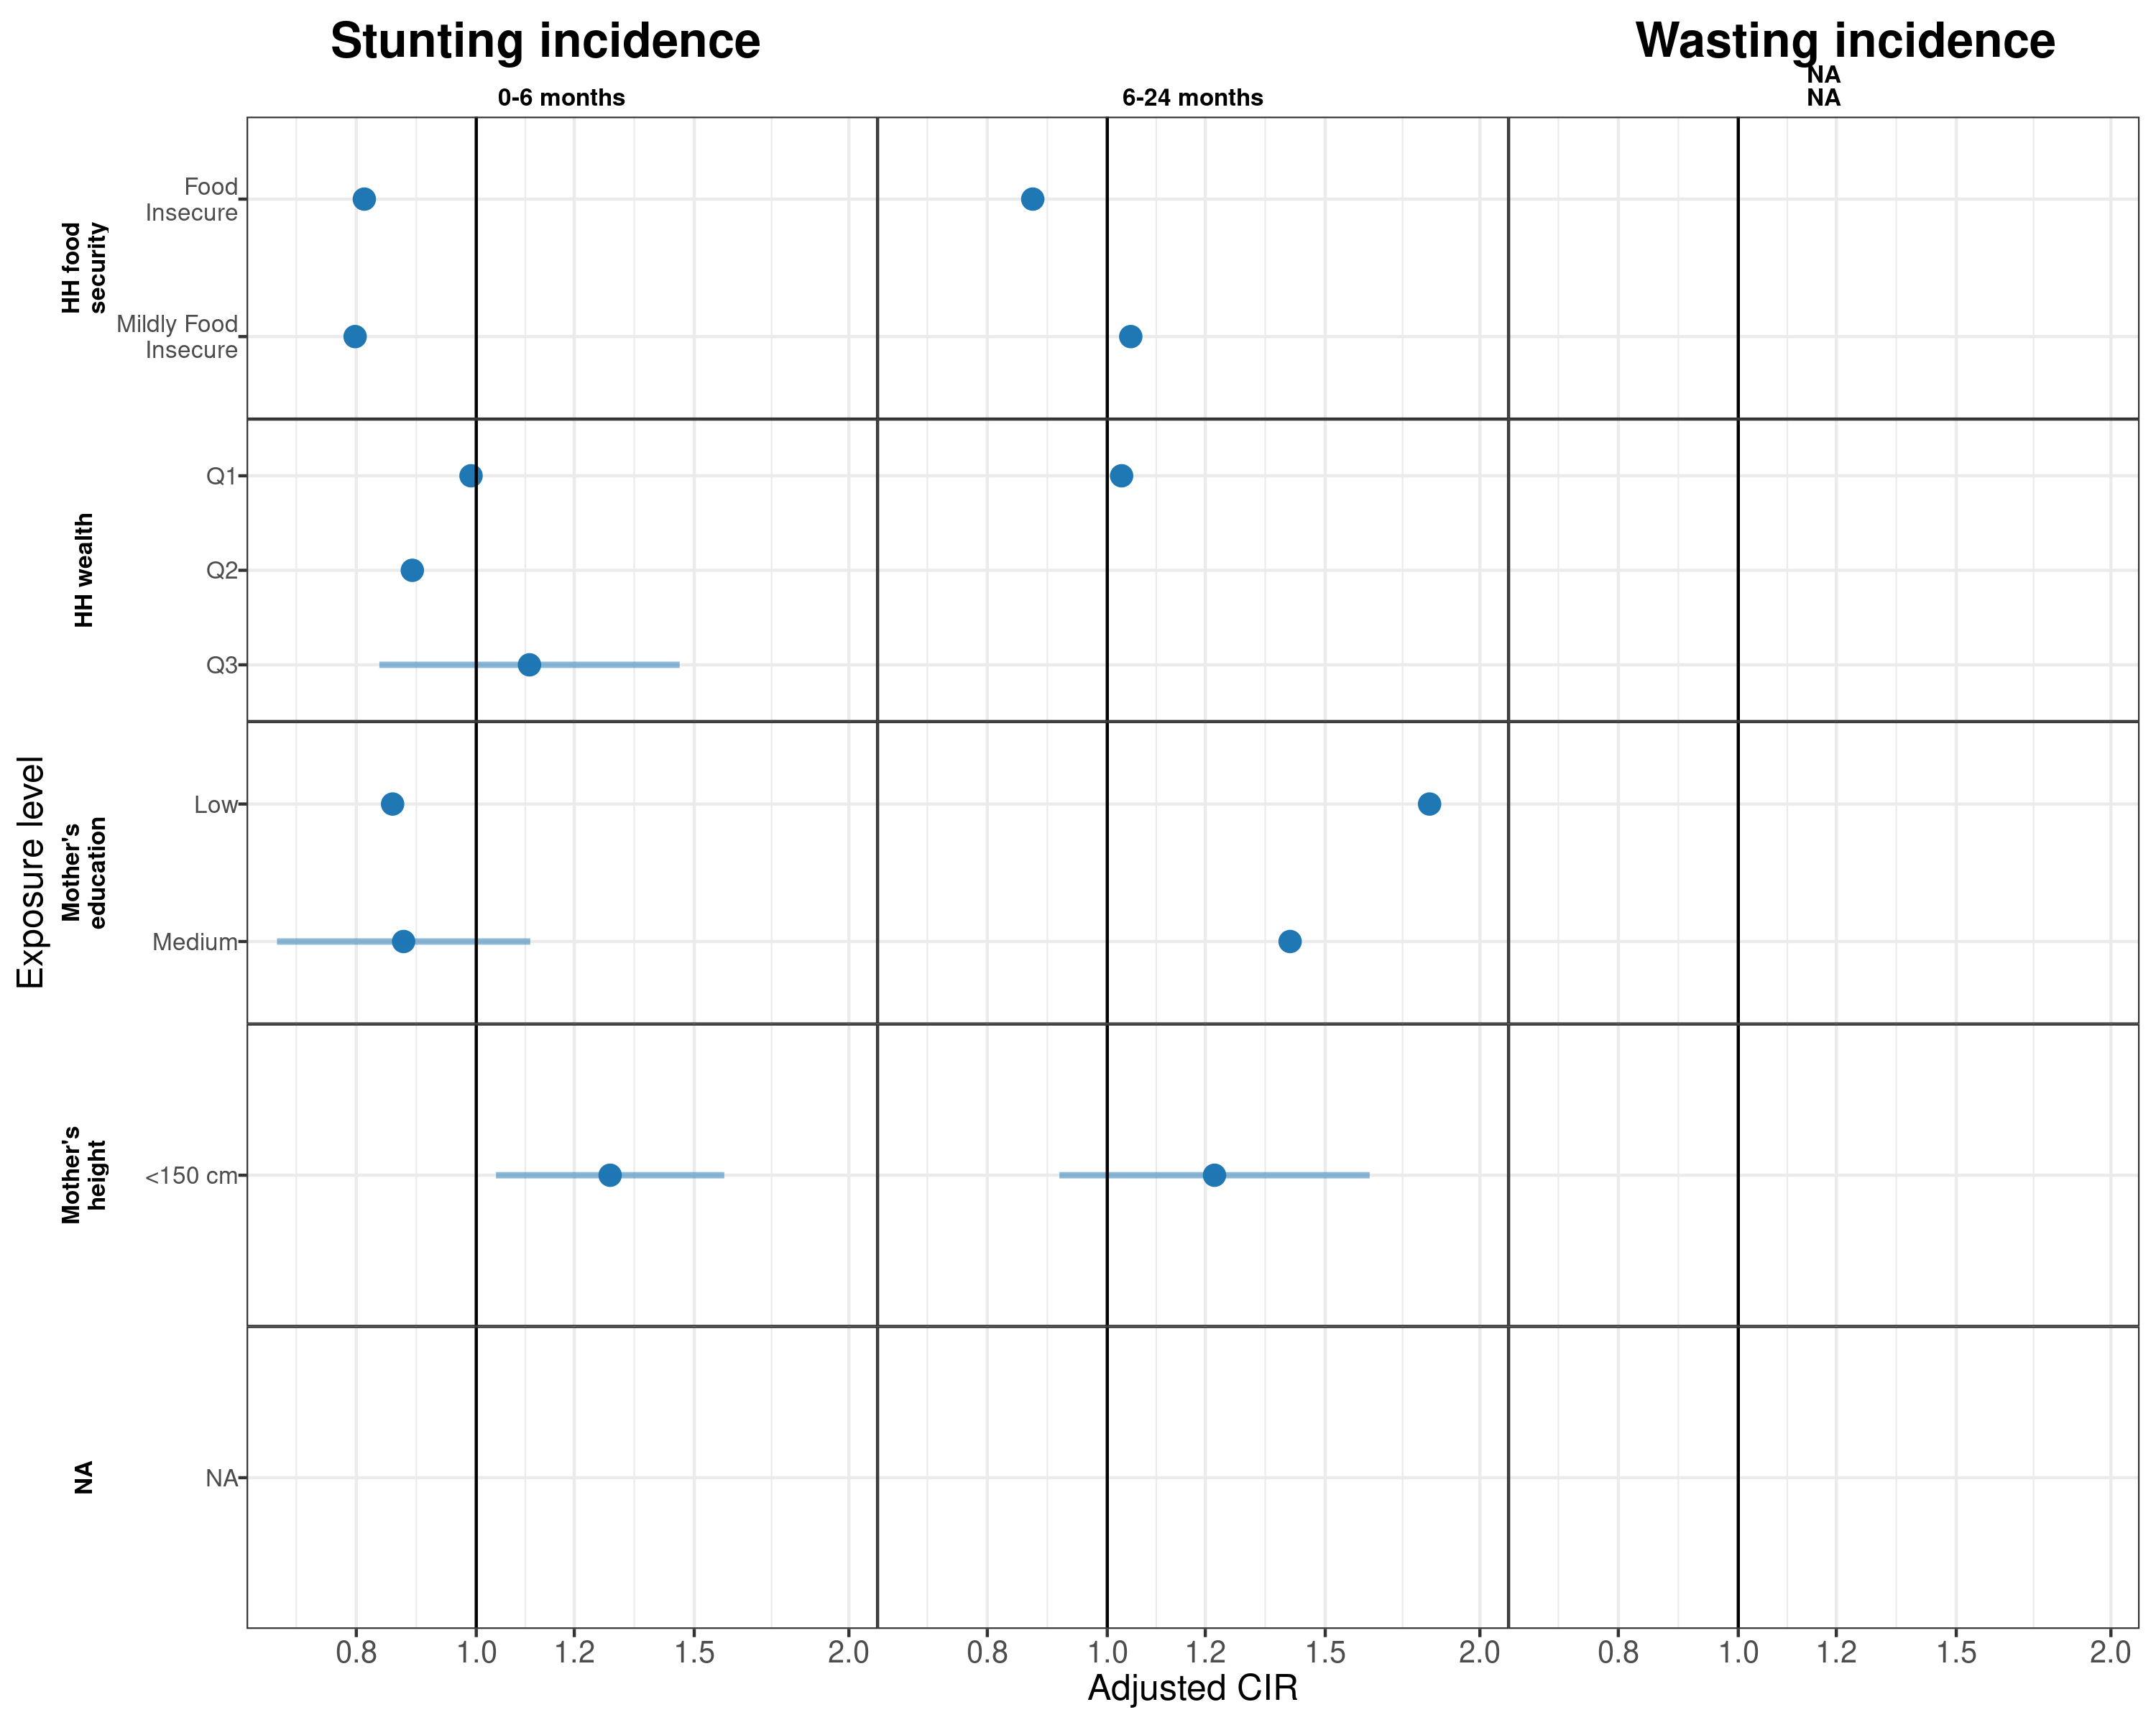
9.5 Associations between key exposures and wasting and stunting cumulative incidence, stratified by the age of the child and by region
South Asia
Africa
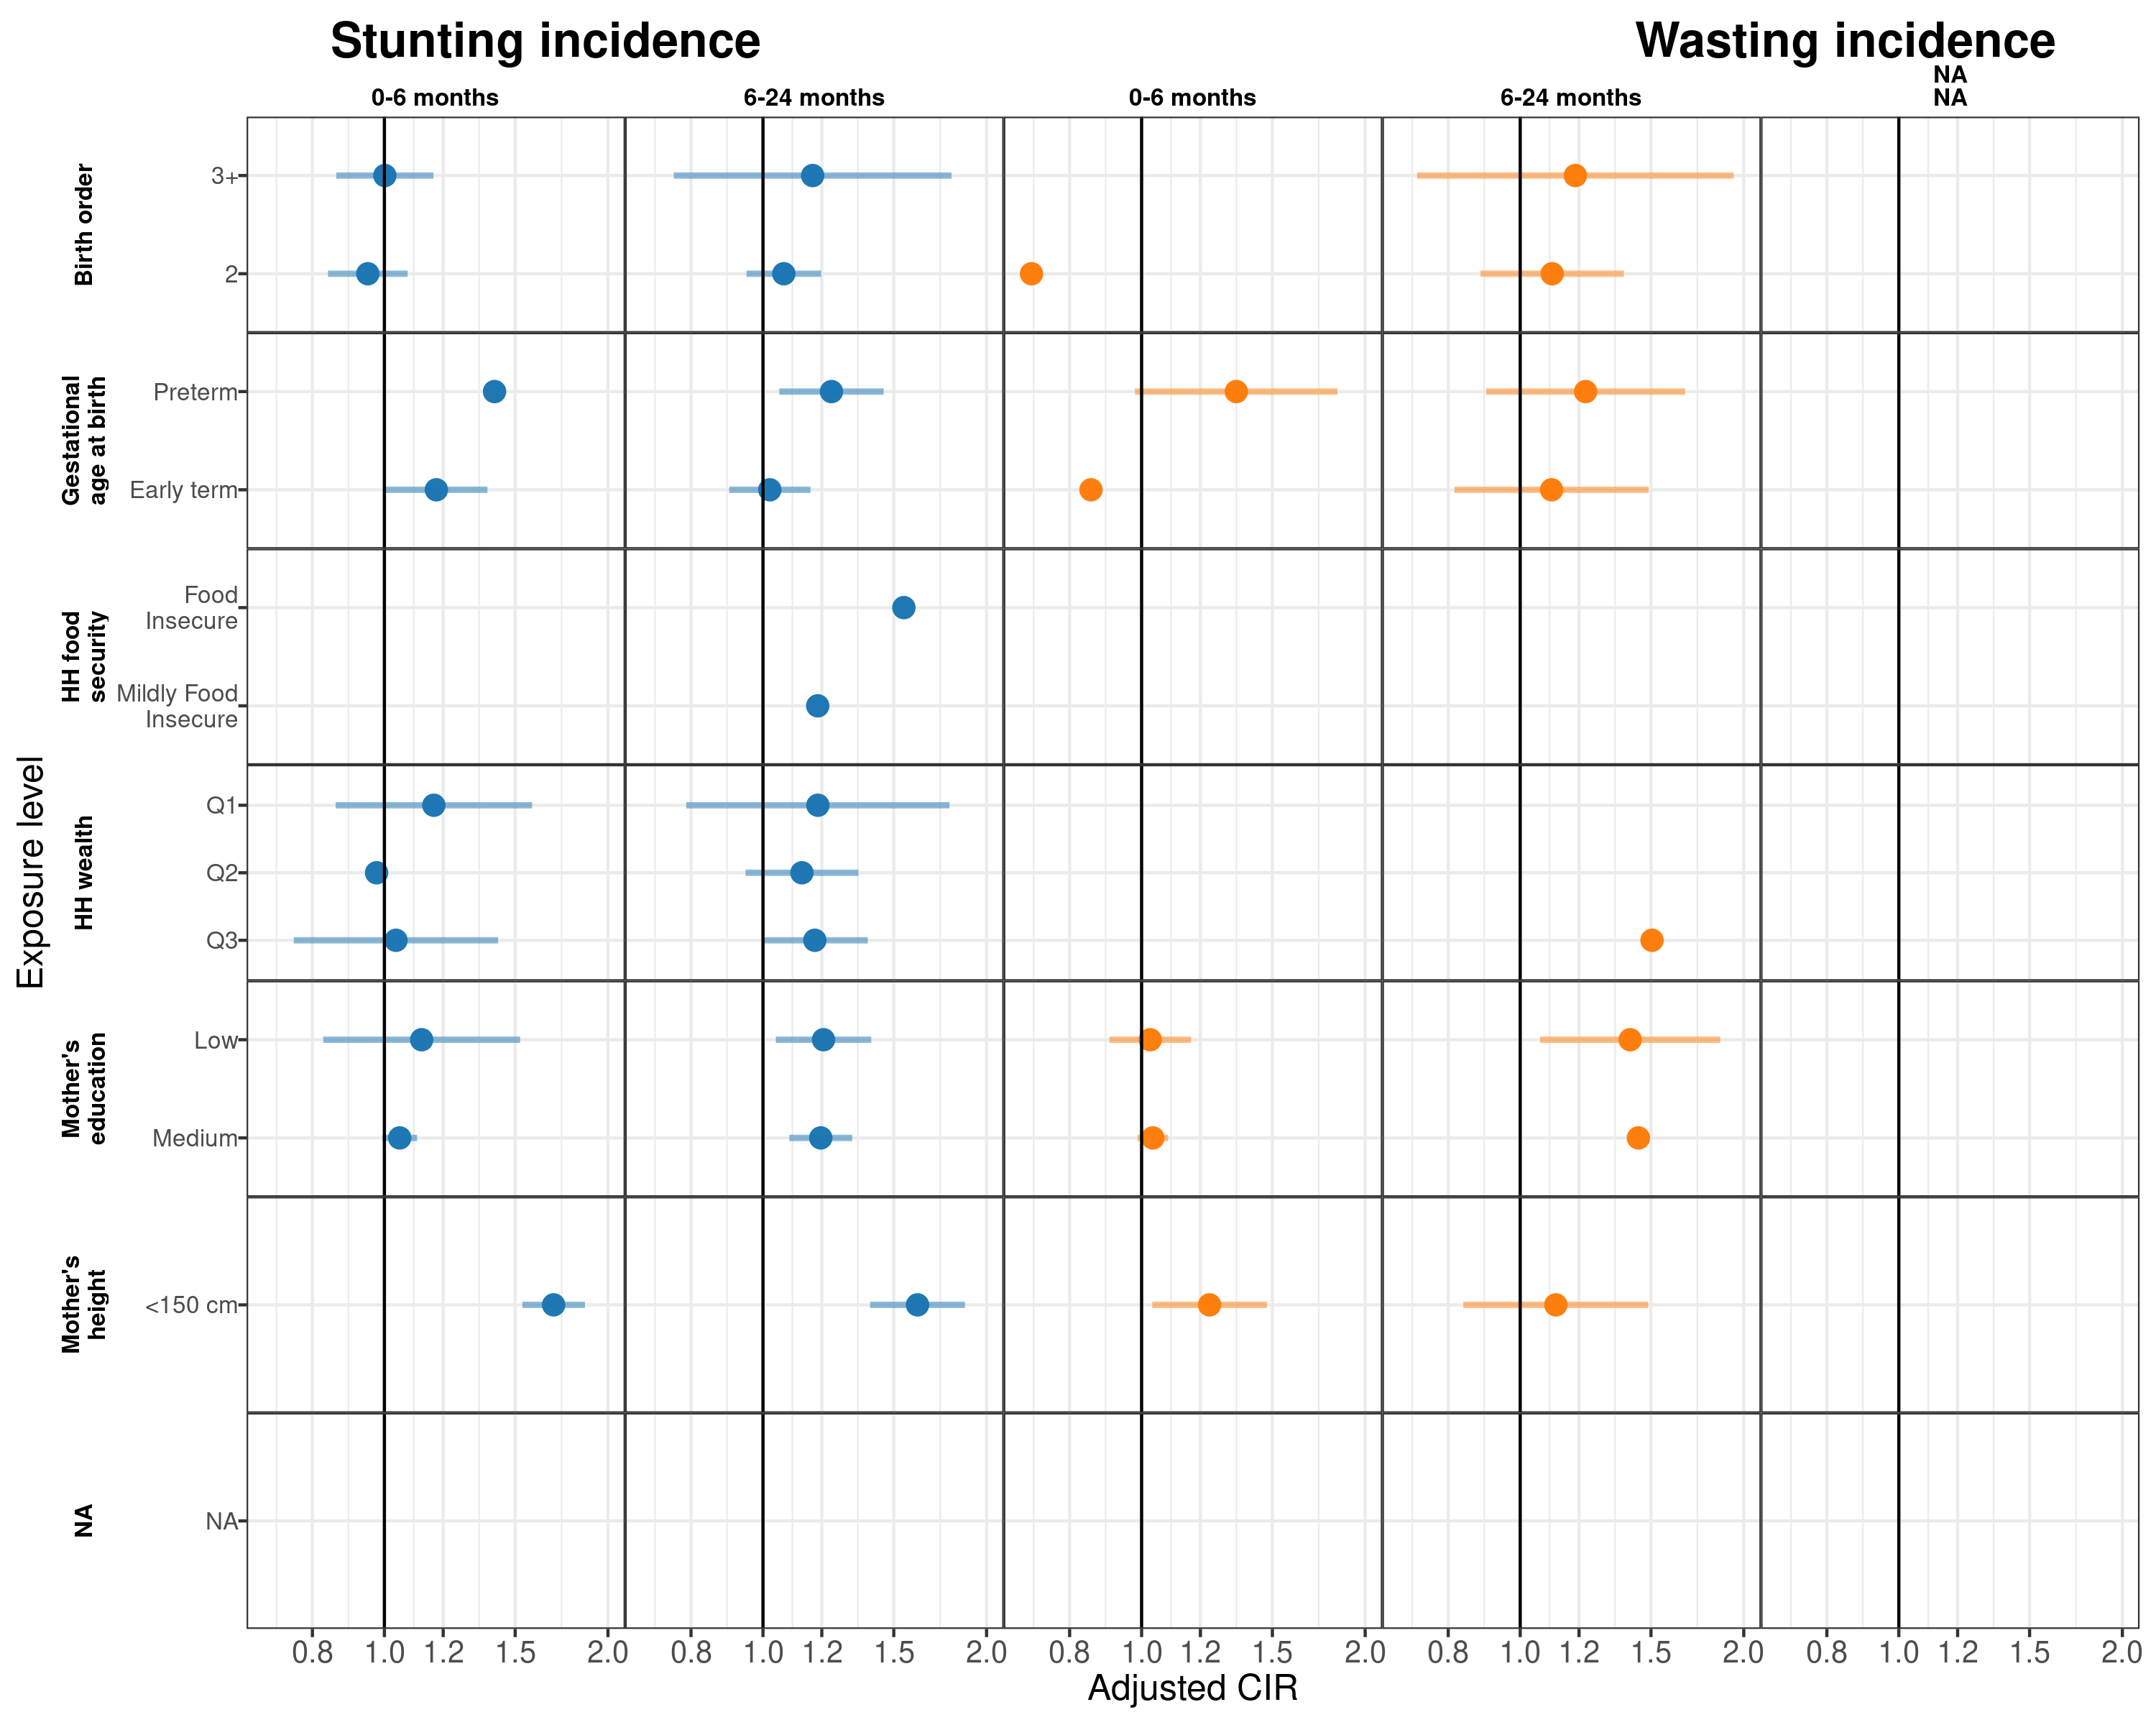
Latin America
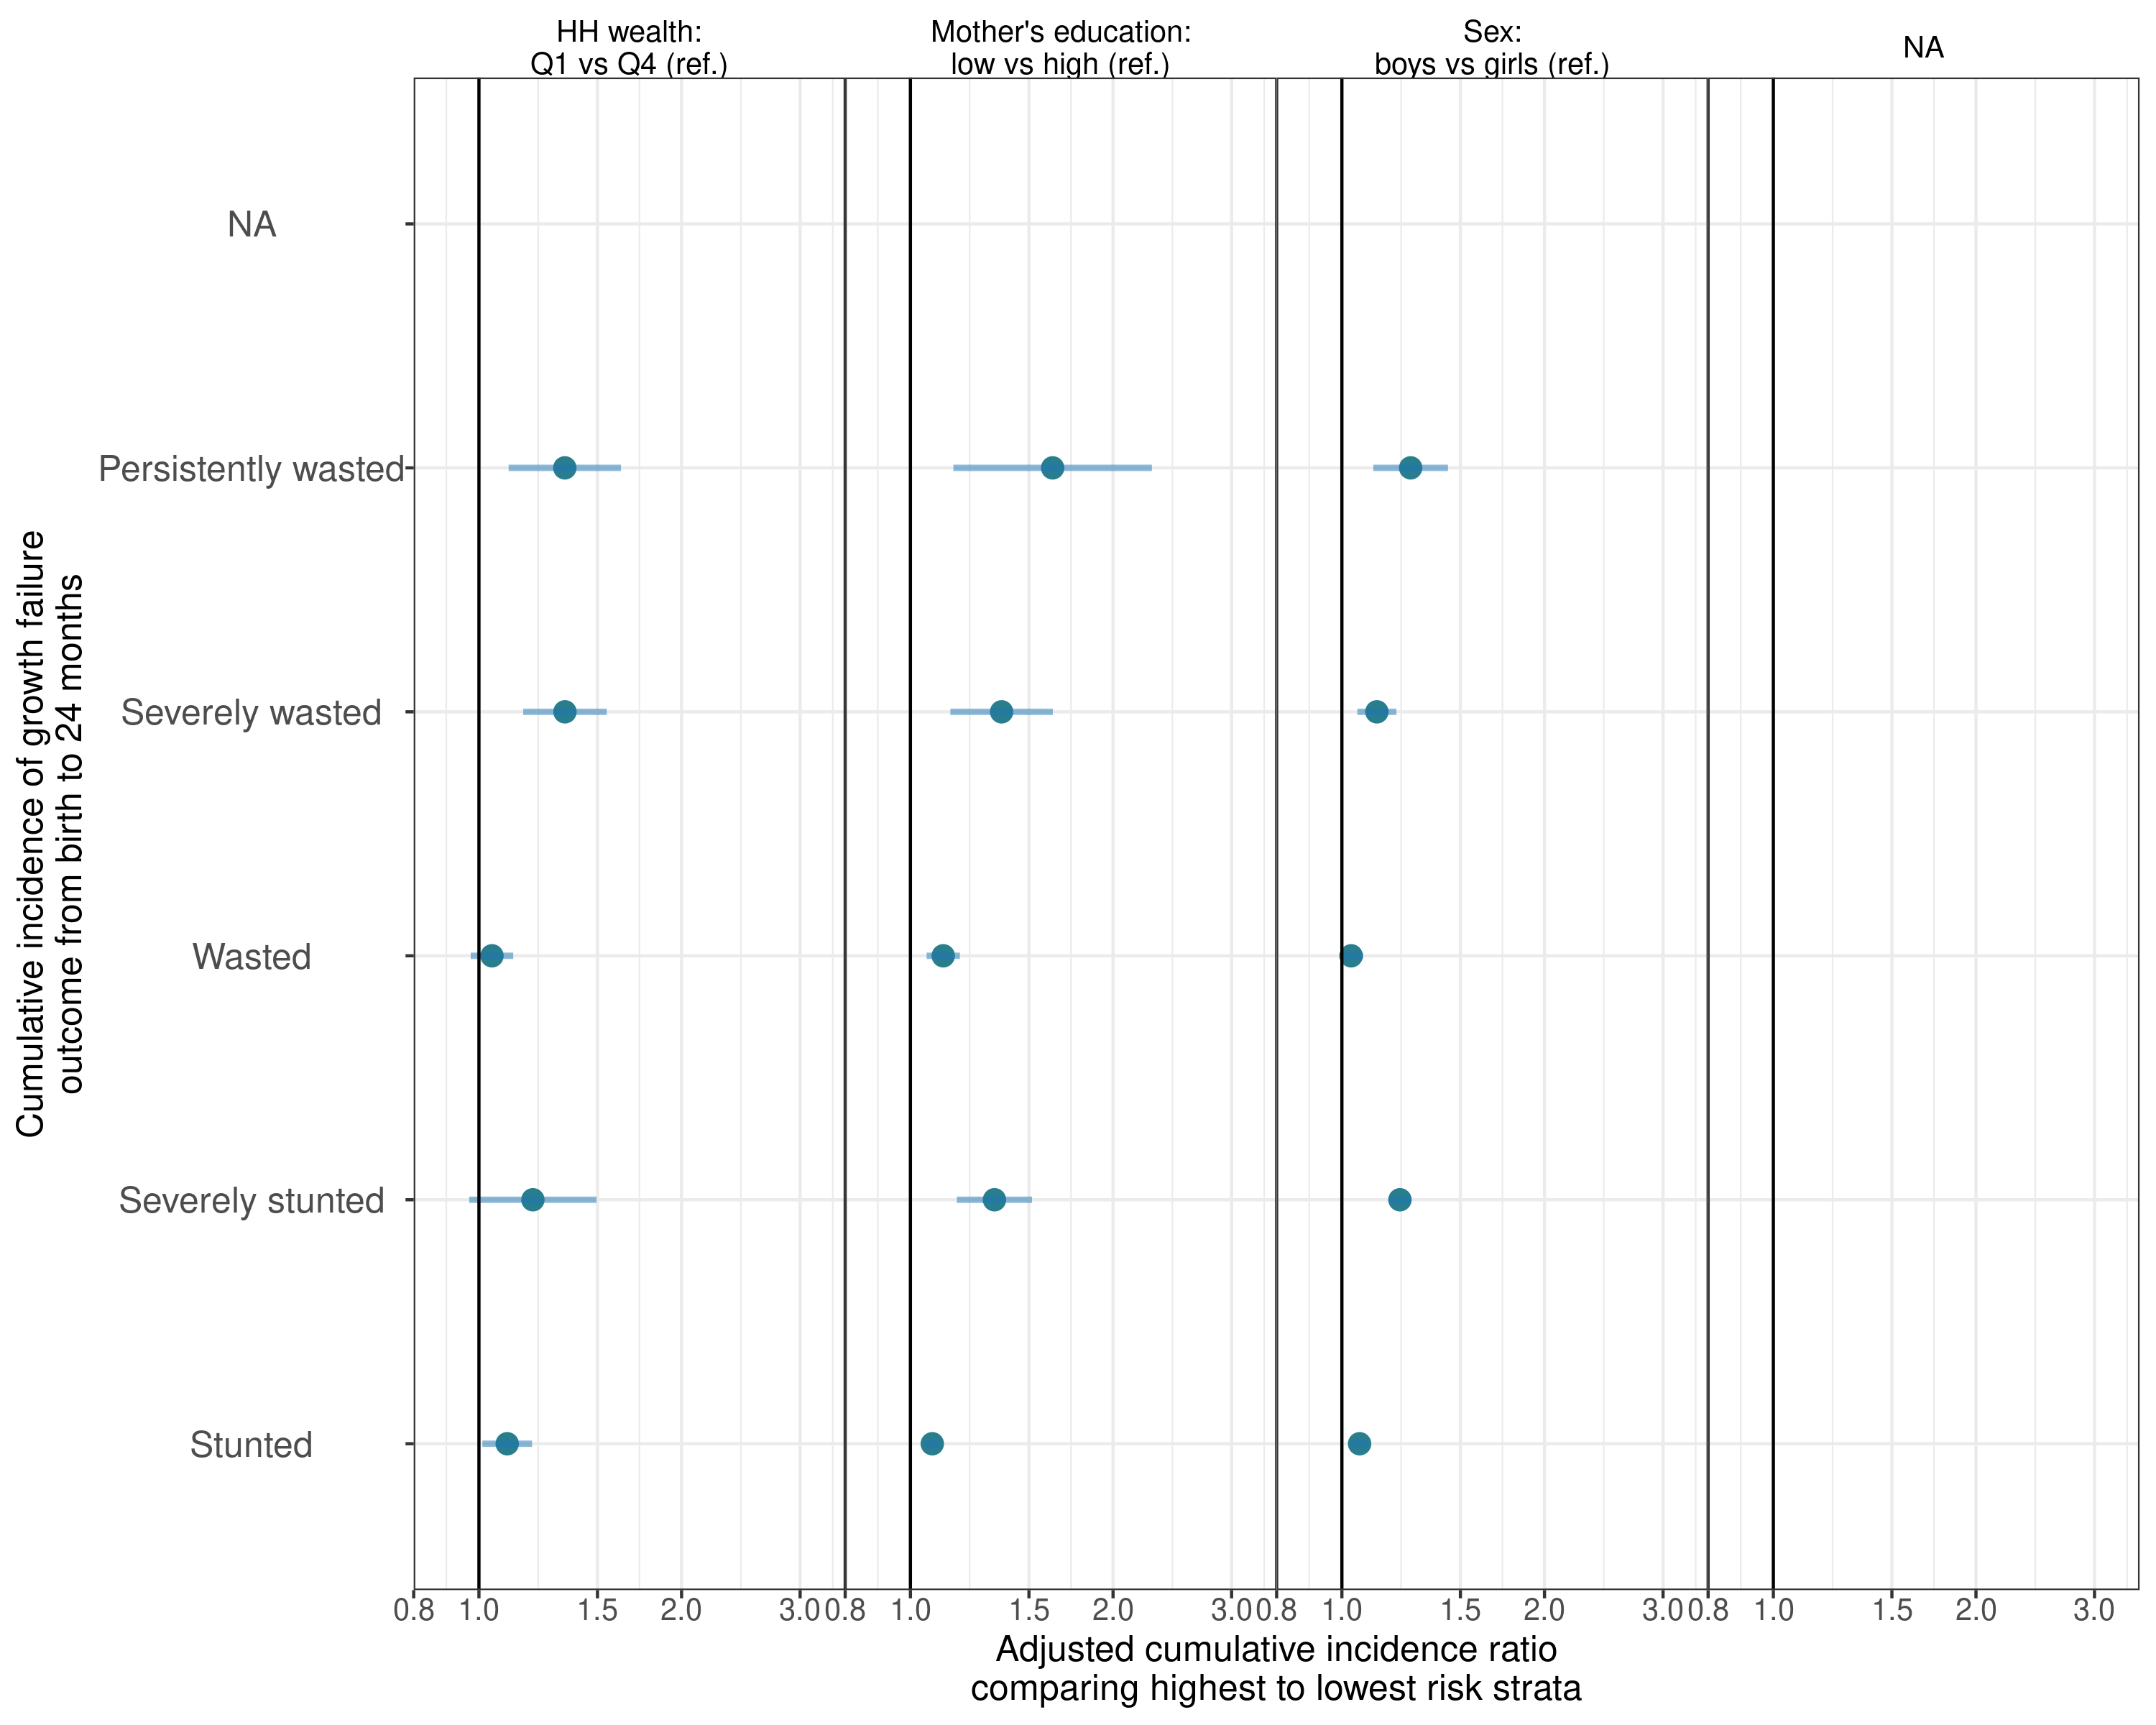
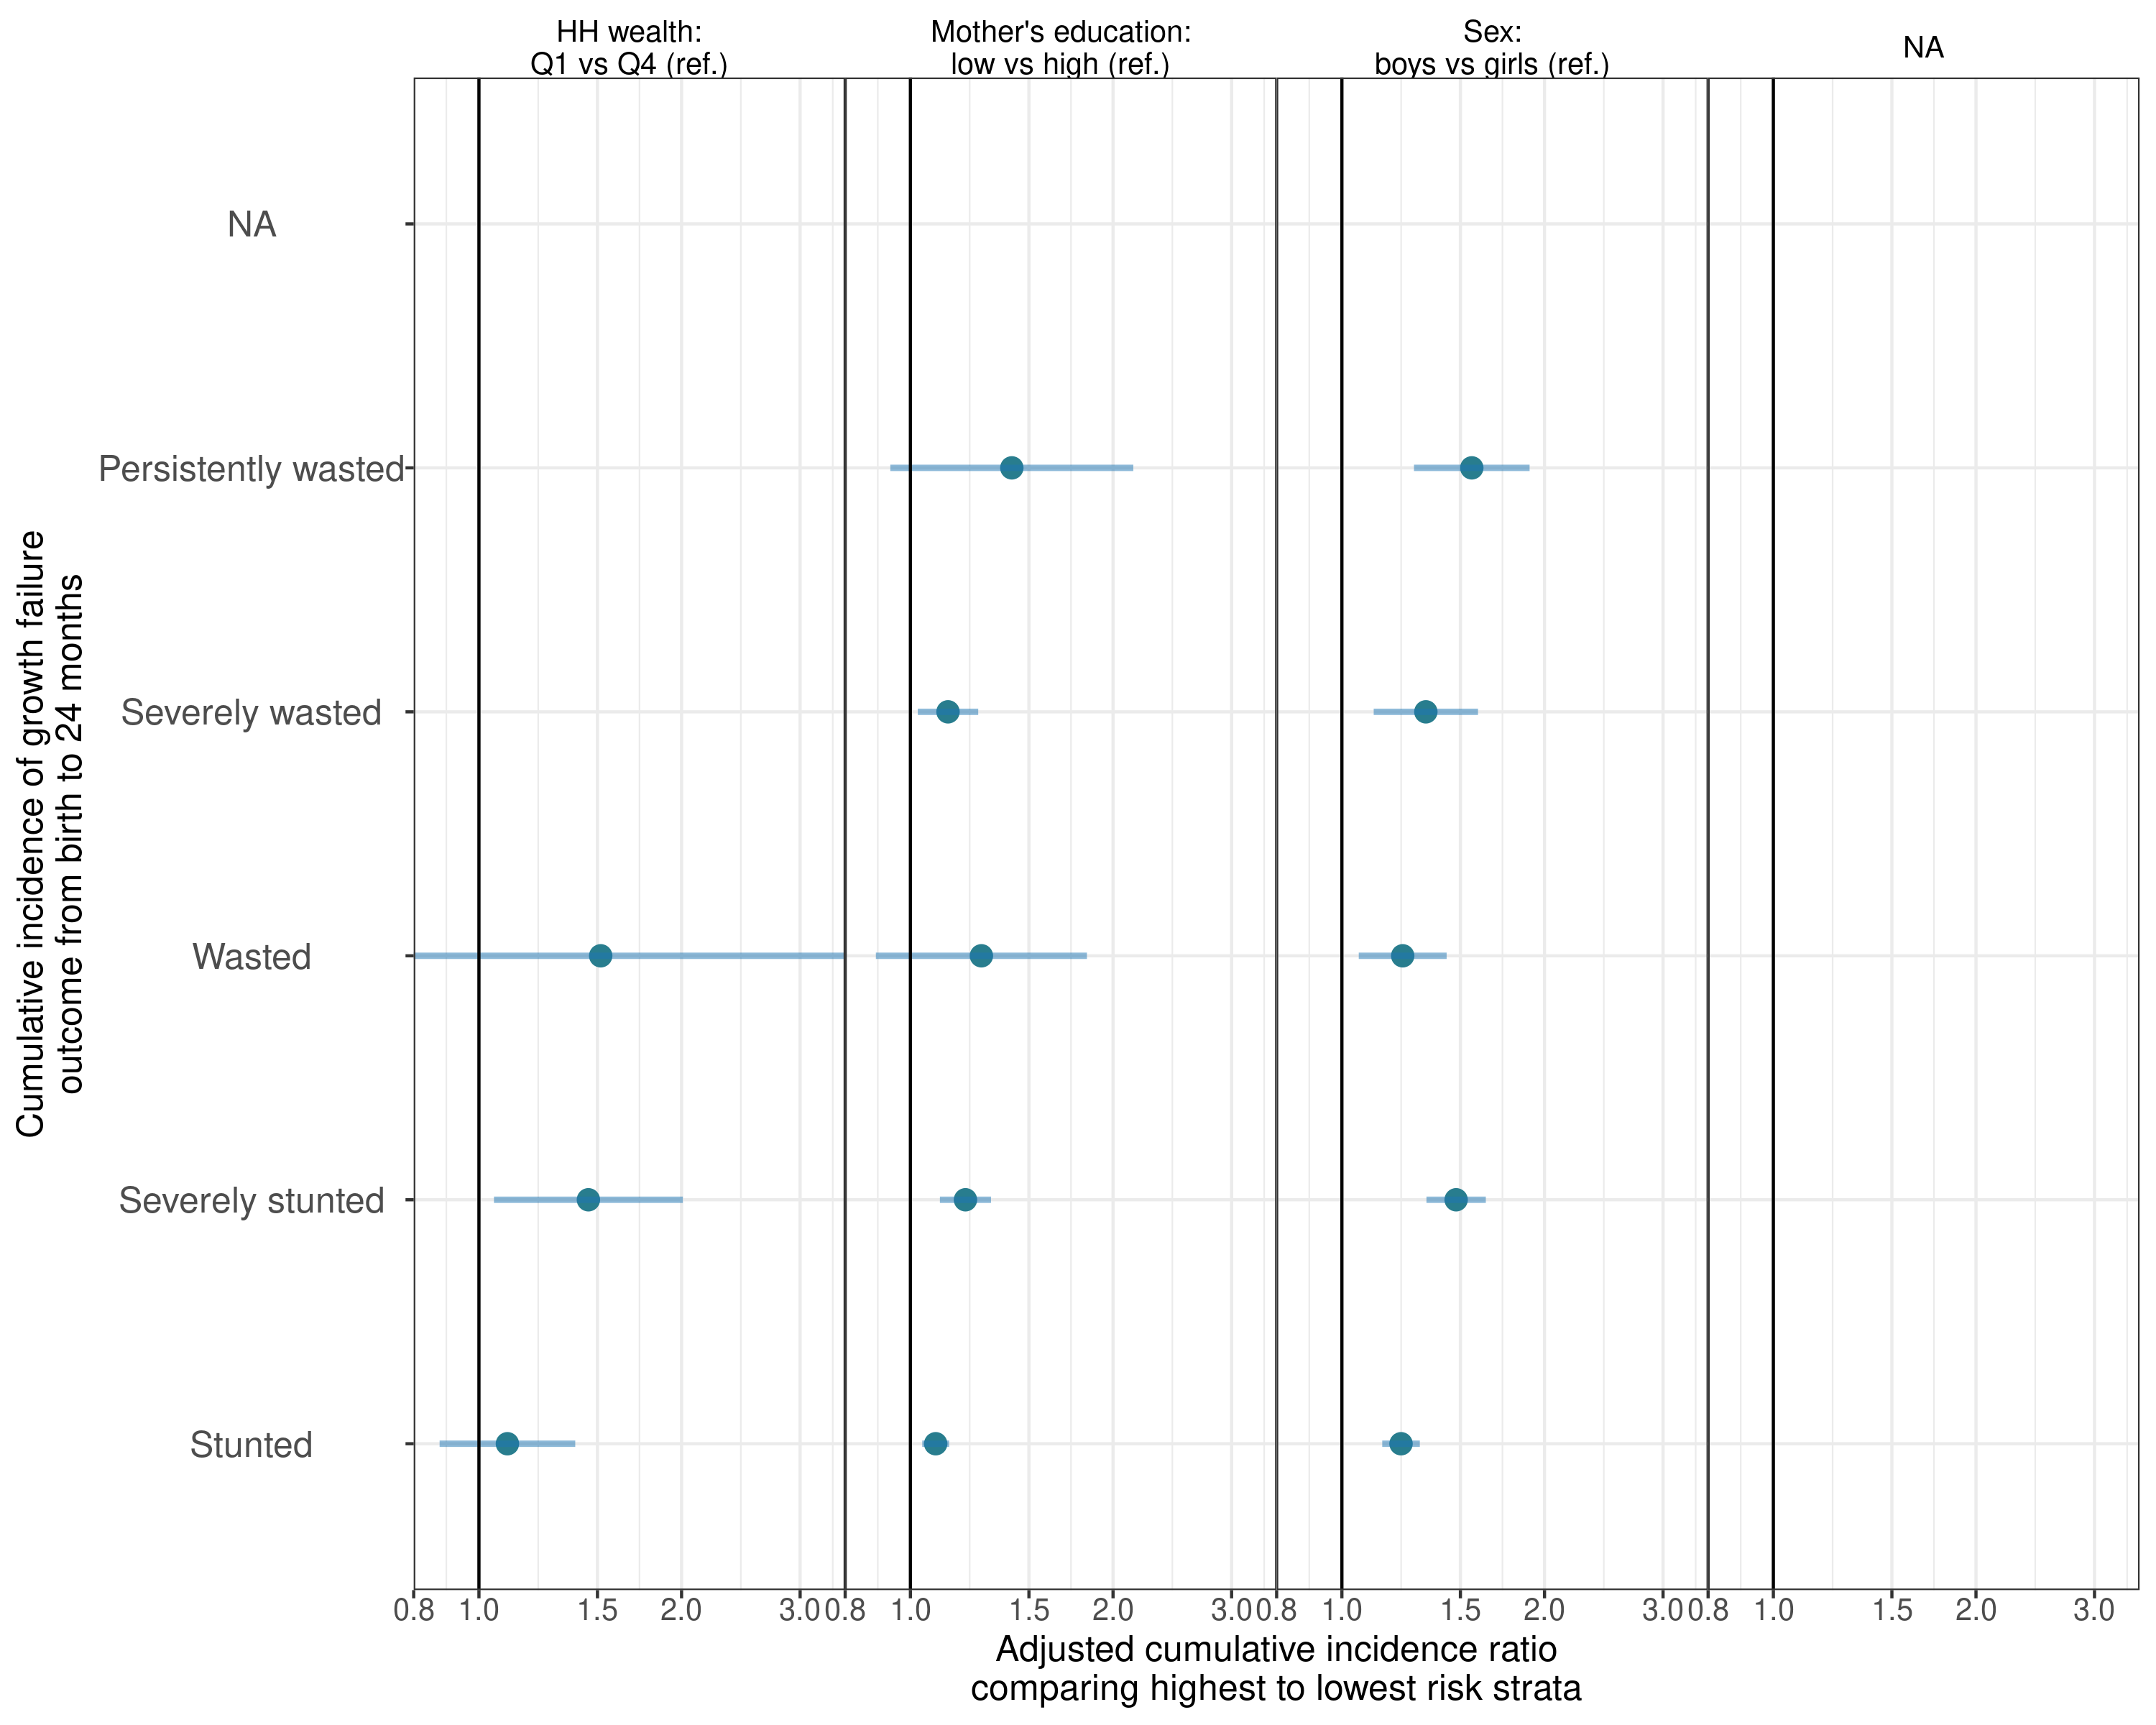
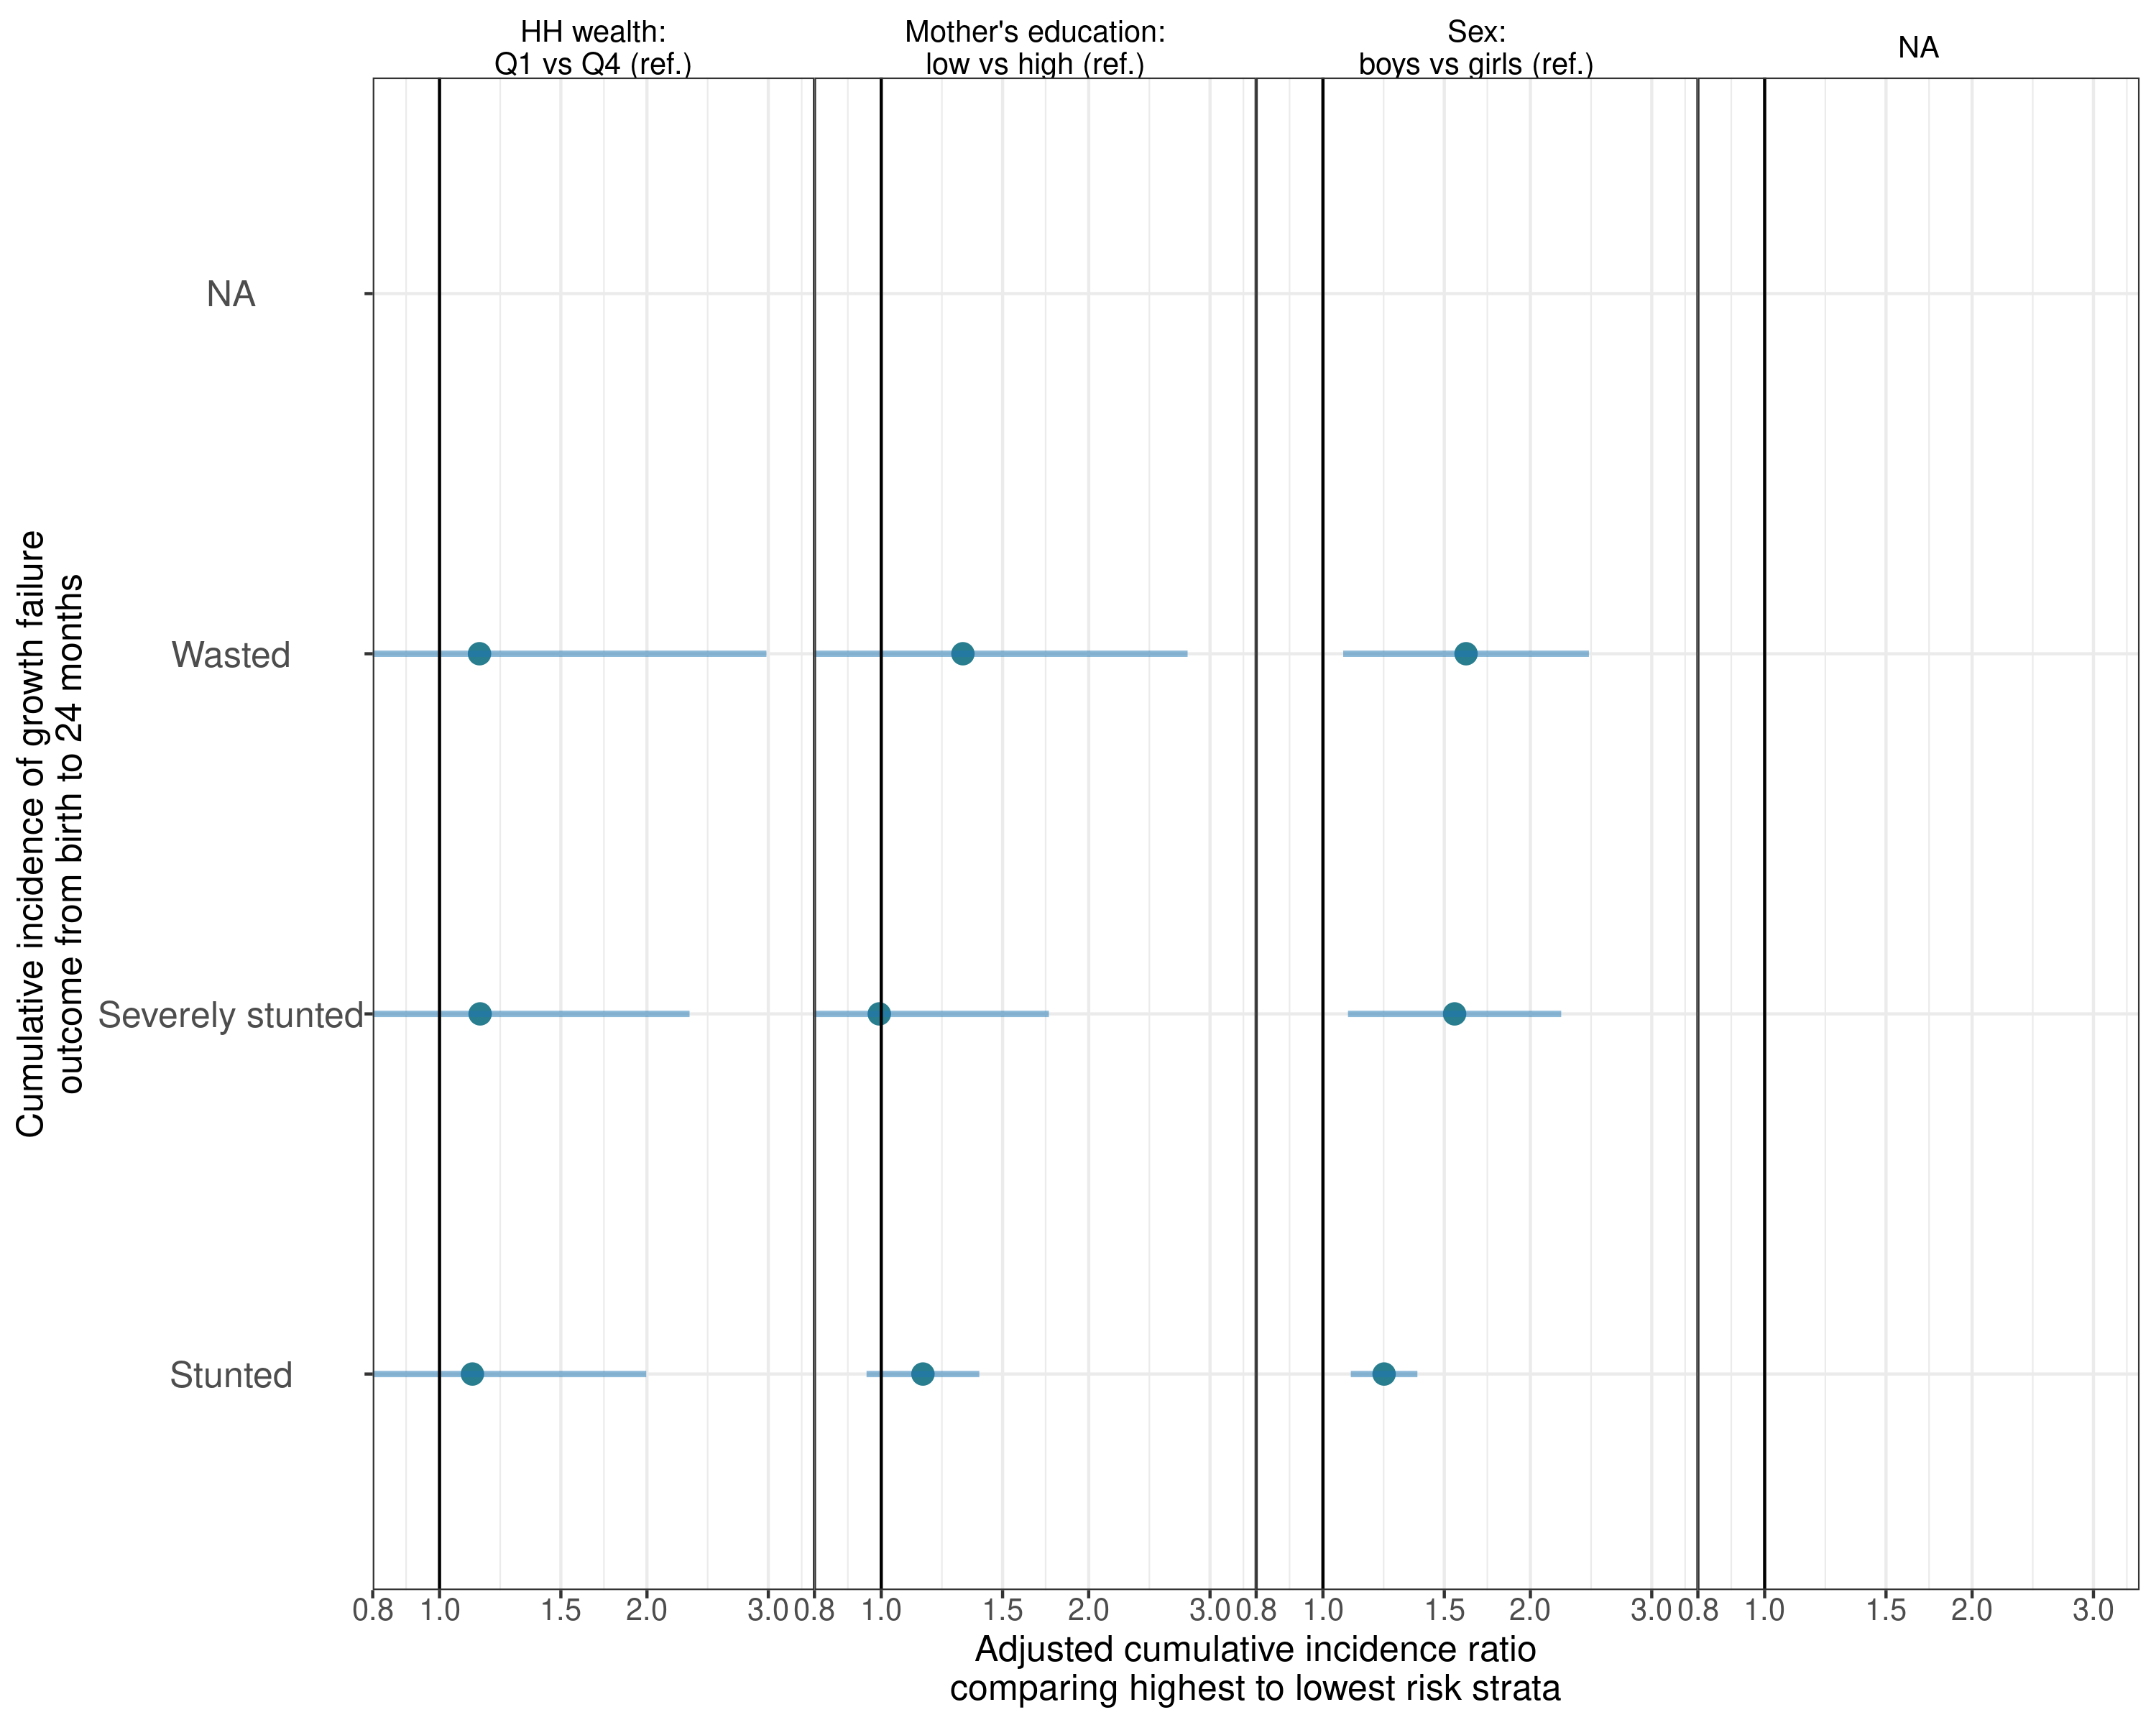
9.6 Associations between key exposures and growth failure of different severities, stratified by region
South Asia
Africa
Latin America
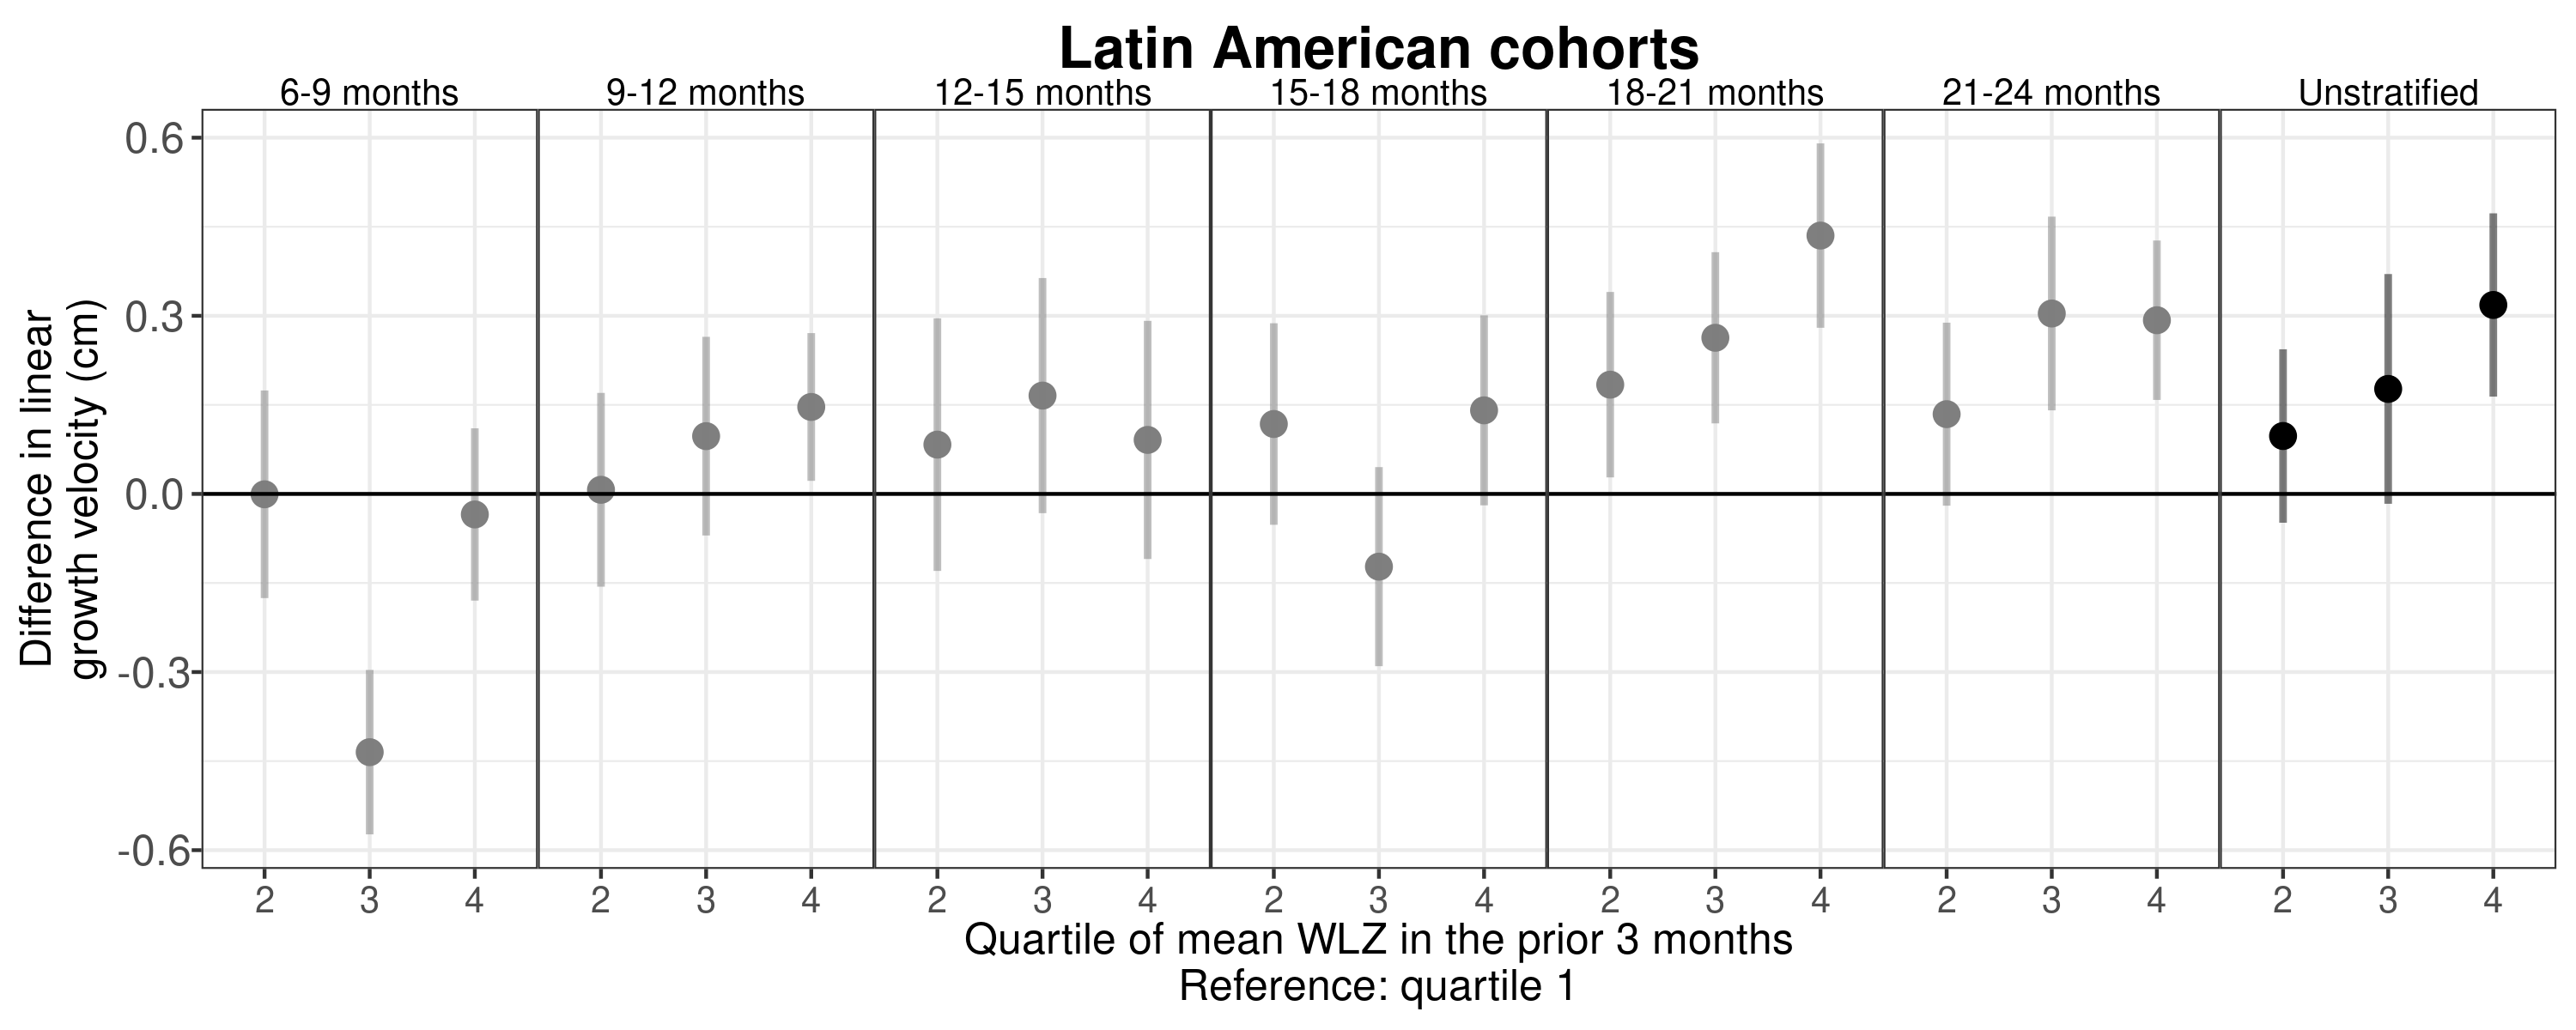
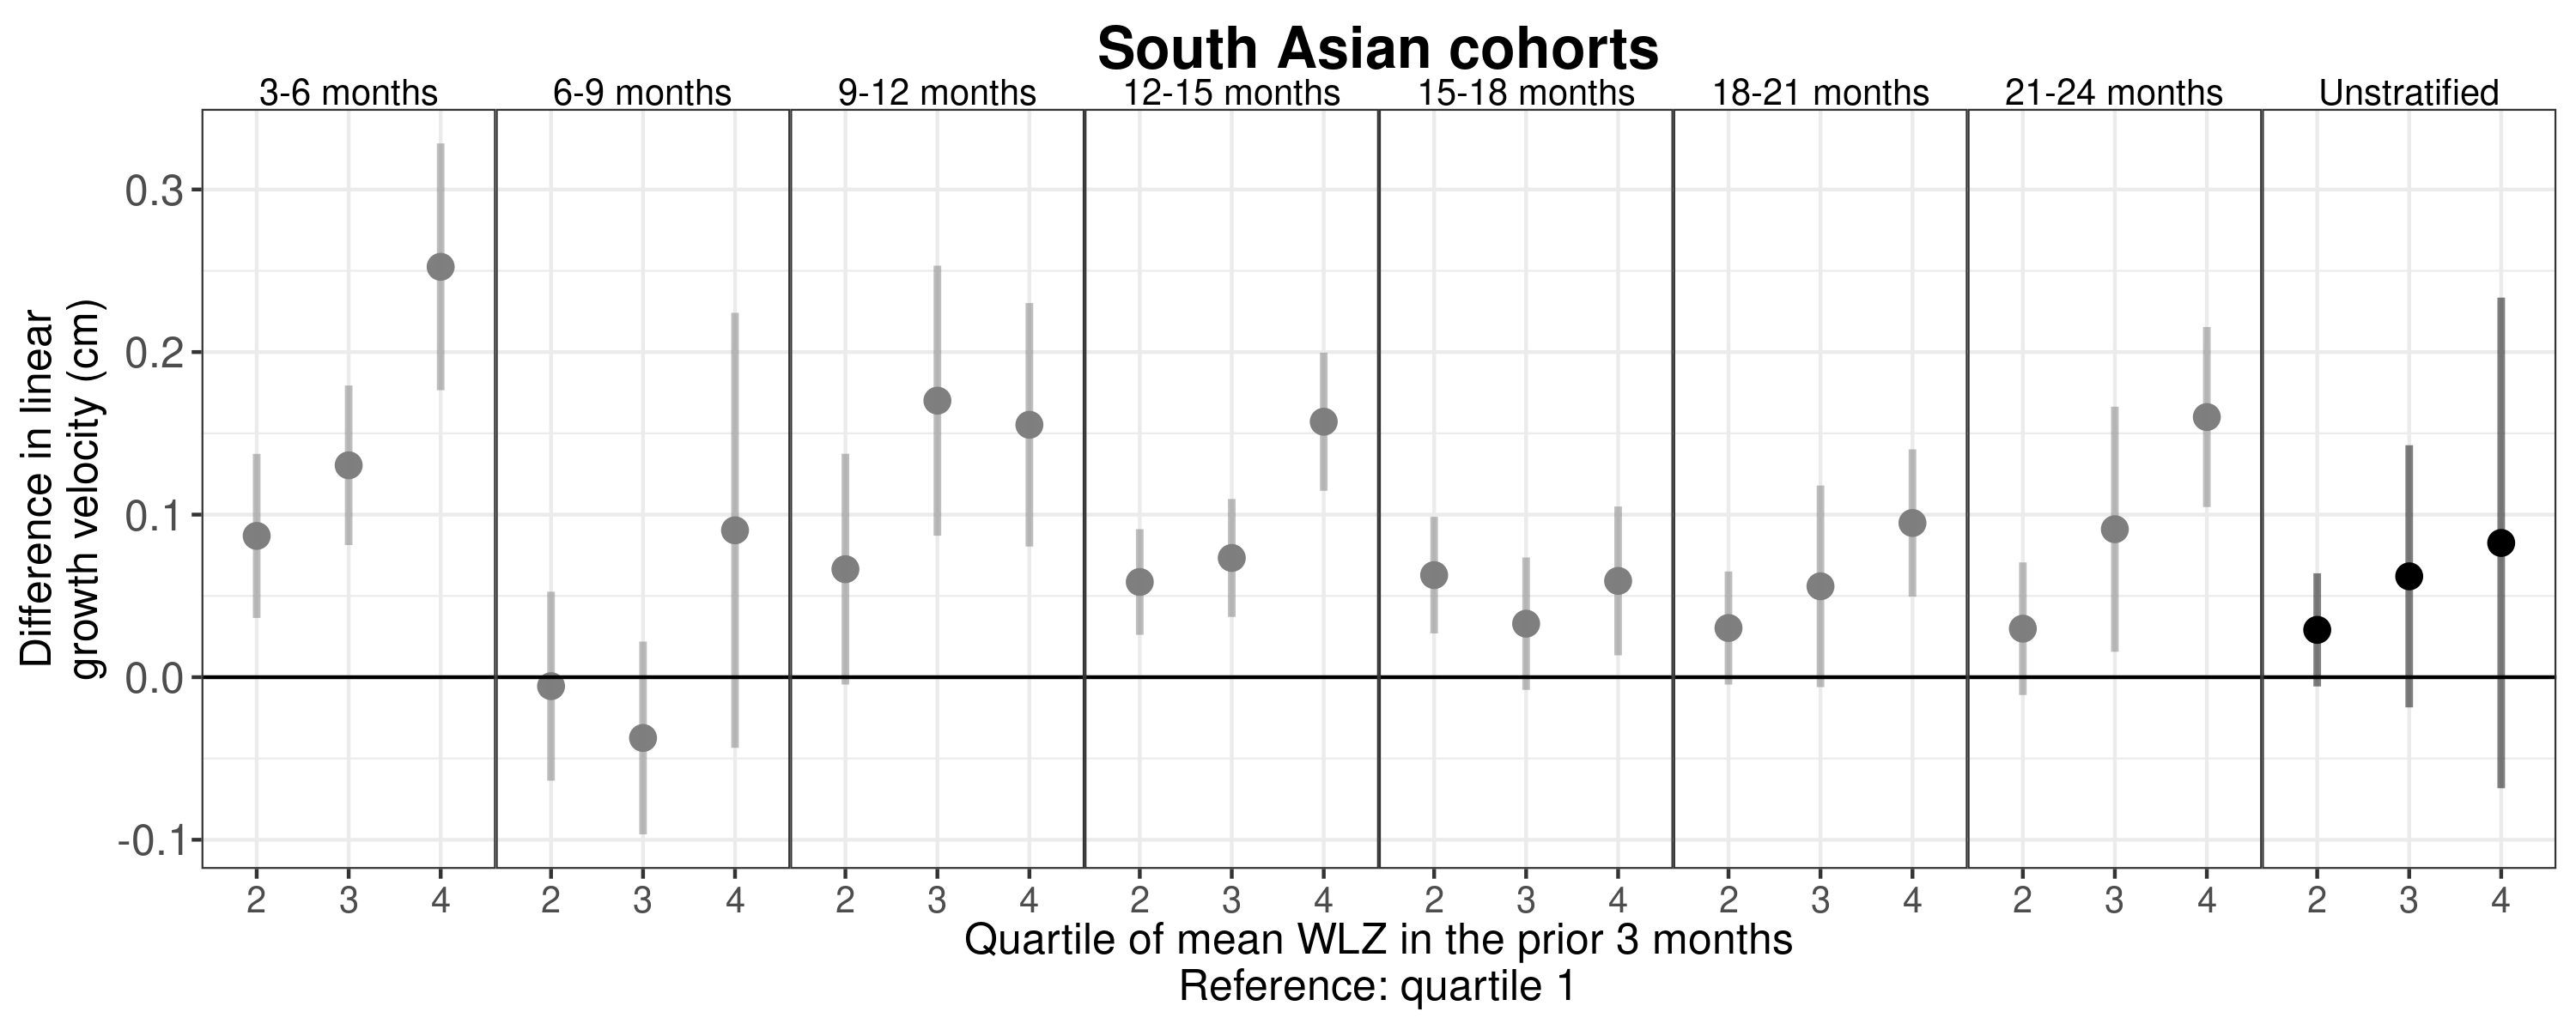
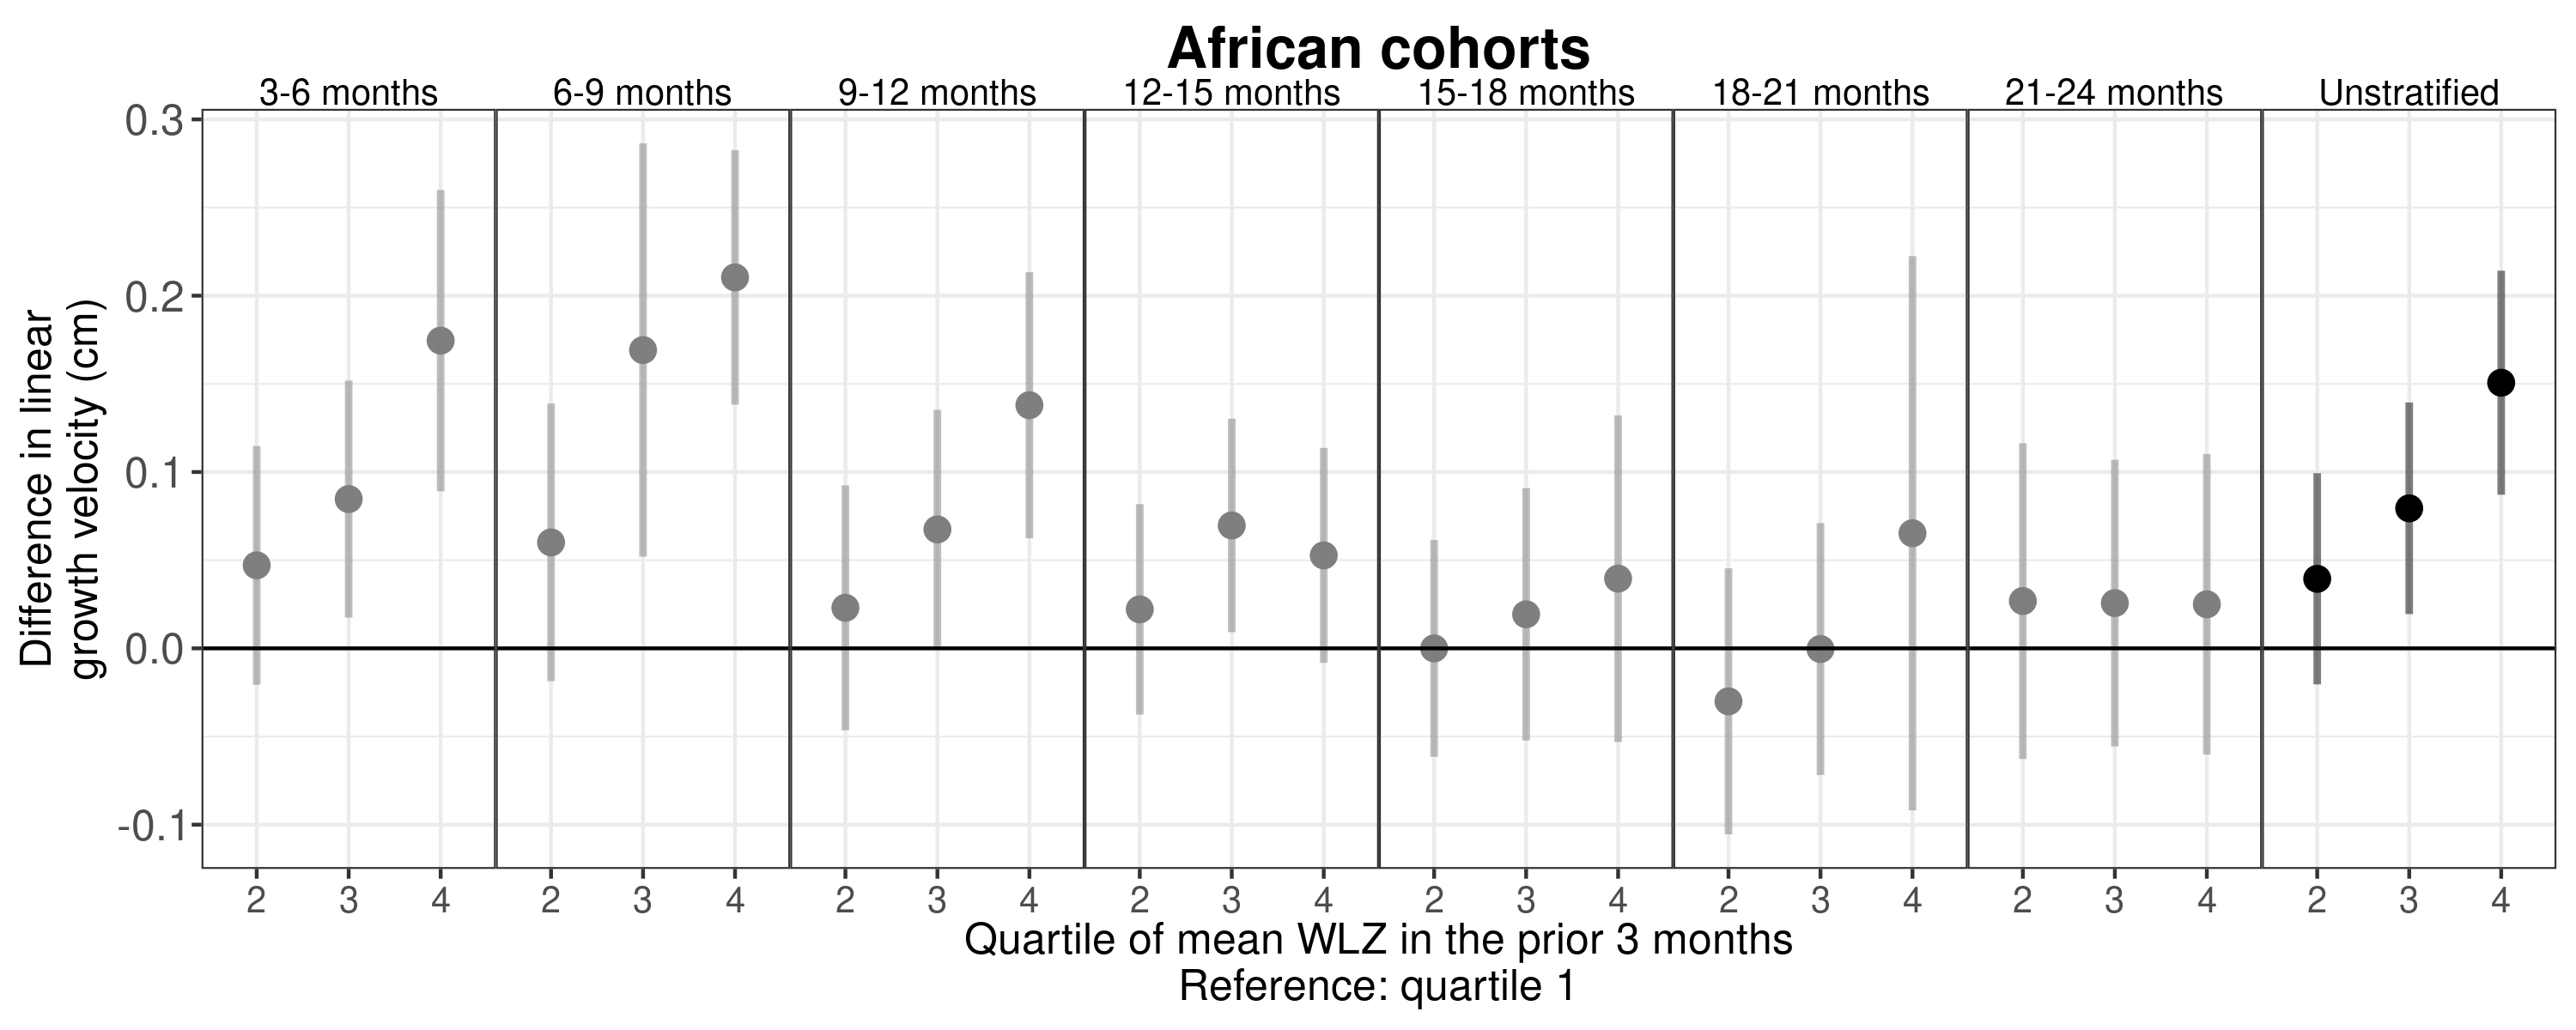
9.7 Adjusted differences in linear growth velocity (in centimeters) across 3-month age 624 bands, by quartile of weight-for-length z-score (WLZ) in the preceding three months, stratified by region.
South Asia
Africa
Latin America