• Stunting Supplementary Information
  • 1 Overview
  • 2 Quality assurance
  • 3 Severe stunting analyses
    • 3.1 Age-specific severe stunting prevalence
    • 3.2 Age-specific severe stunting incidence
  • 4 Assessment of potential secular trends
  • 5 Analyses of age at first measurement
    • 5.1 Histogram of first measurement within age 0-30 days
      • 5.1.1 All cohorts
      • 5.1.2 Cohort-stratified
    • 5.2 Histogram of age at enrollment
      • 5.2.1 All cohorts
      • 5.2.2 Cohort-stratified
  • 6 Cohort-specific results
    • 6.1 Mean length-for-age Z-score by age
      • 6.1.1 Africa
      • 6.1.2 Latin America
      • 6.1.3 South Asia
    • 6.2 Age-specific prevalence
      • 6.2.1 Africa
      • 6.2.2 Latin America
      • 6.2.3 South Asia
    • 6.3 Age-specific incidence
      • 6.3.1 Africa
      • 6.3.2 Latin America
      • 6.3.3 South Asia
    • 6.4 Length velocity by age and sex
      • 6.4.1 Africa
      • 6.4.2 Latin America
      • 6.4.3 South Asia
    • 6.5 LAZ velocity by age and sex
      • 6.5.1 Africa
      • 6.5.2 Latin America
      • 6.5.3 South Asia
  • 7 Primary analyses excluding the PROBIT study
    • 7.1 Mean length-for-age Z-score by age
      • 7.1.1 Including PROBIT
      • 7.1.2 Excluding PROBIT
    • 7.2 Age-specific prevalence
      • 7.2.1 Including PROBIT
      • 7.2.2 Excluding PROBIT
    • 7.3 Age-specific incidence
      • 7.3.1 Including PROBIT
      • 7.3.2 Excluding PROBIT
  • 8 Analysis with monthly cohorts
    • 8.1 Mean length-for-age Z-score by age
      • 8.1.1 All eligible cohorts
      • 8.1.2 Cohorts that measured monthly from birth to 24 months
    • 8.2 Age-specific stunting prevalence
      • 8.2.1 All eligible cohorts
      • 8.2.2 Cohorts that measured monthly from birth to 24 months
    • 8.3 Age-specific stunting incidence
      • 8.3.1 All eligible cohorts
      • 8.3.2 Cohorts that measured monthly from birth to 24 months
    • 8.4 Linear growth velocity
      • 8.4.1 All eligible cohorts
      • 8.4.2 Cohorts that measured monthly from birth to 24 months
  • 9 Sensitivity analysis using fixed effects
    • 9.1 Age-specific prevalence
      • 9.1.1 Random effects
      • 9.1.2 Fixed effects
    • 9.2 Age-specific incidence
      • 9.2.1 Random effects
      • 9.2.2 Fixed effects
    • 9.3 Changes in stunting status by age
      • 9.3.1 Random effects
      • 9.3.2 Fixed effects
    • 9.4 Linear growth velocity
      • 9.4.1 Random effects
      • 9.4.2 Fixed effects
  • Published with bookdown

Supplement to Early childhood linear growth failure in low-and middle-income countries

Chapter 4 Assessment of potential secular trends

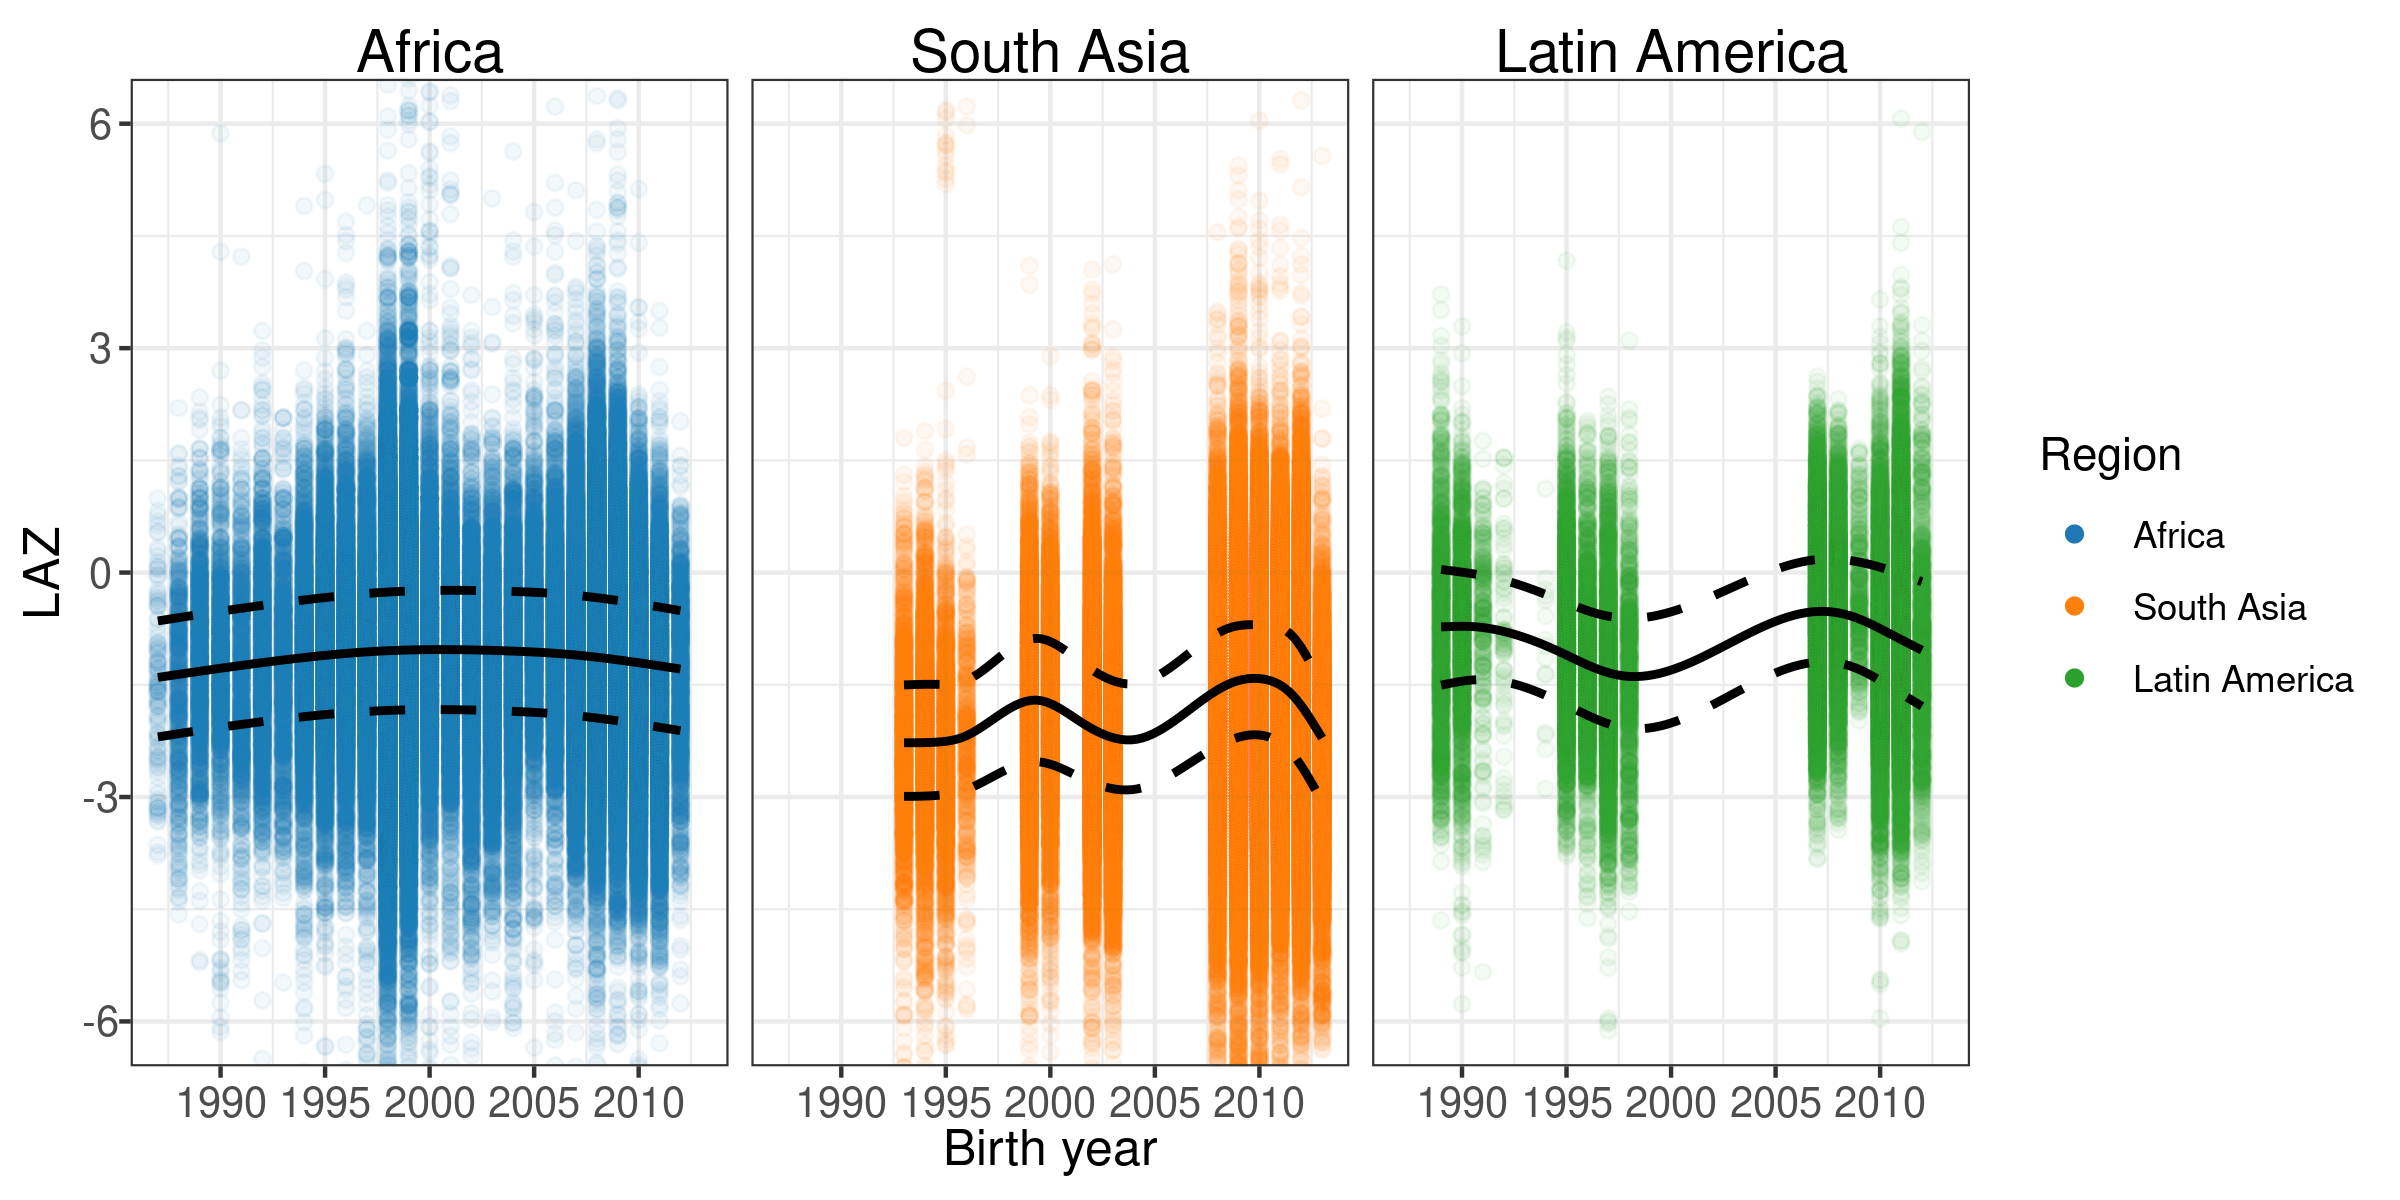
This study included cohorts that measured child growth from 1987 to 2017. To assess potential secular trends, we plotted the mean length-for-age Z-score (LAZ) over time. The plot below shows the individual observations from included studies over this range of years. Curves were fit to the data using generalized additive models, with the solid line fit through the median LAZ by birth year, and the dashed lines mark the 1st and 3rd quartiles. There does not appear to be a secular trend in LAZ.